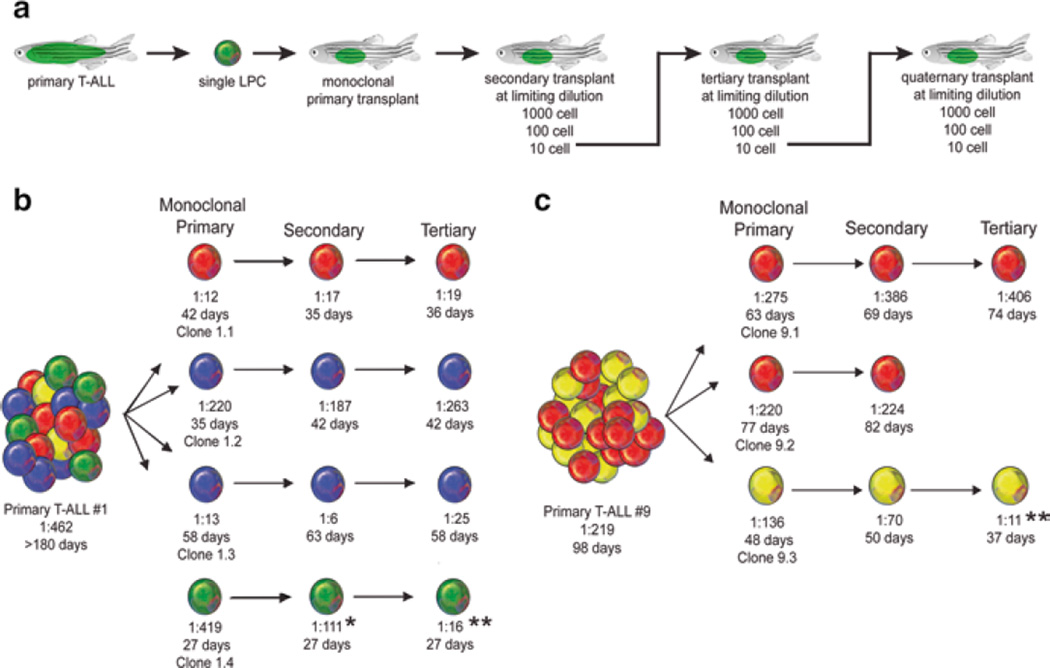
Fig. 5.
Clonal evolution drives intratumoral heterogeneity and can lead to increased LPC Frequency. (a) A schematic of the cell transplantation screen designed to identify phenotypic differences between single leukemic clones. (b, c) Schematic of results from primary T-ALL #1 (b) and T-ALL #9 (c). *Denotes a significant increase in LPC frequency from monoclonal primary to secondary transplant (p = 0.02). **Denotes a significant increase in LPC frequency from monoclonal primary transplant T-ALL compared with tertiary transplanted leukemia (p<0.0001). Clones are color coded based on Tcrβ-rearrangements. (Republished with permission from Elsevier) [126]

