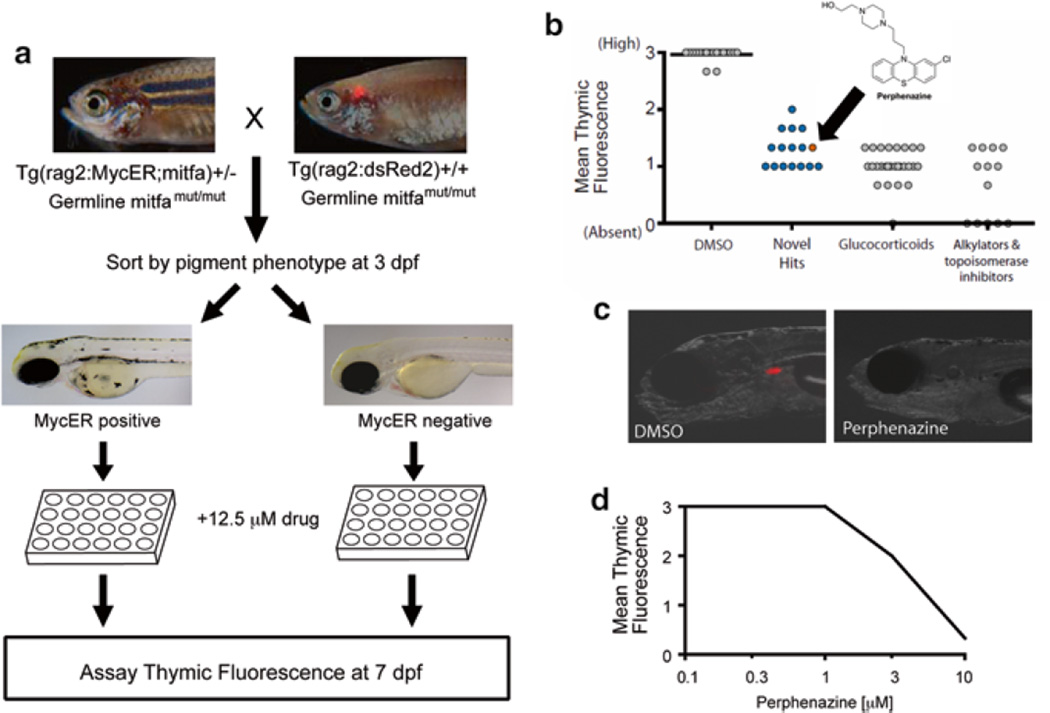
Fig. 6.
Zebrafish screen for small molecules that are toxic to MYC-overexpressing thymocytes. (a) Primary screen design. (b) Hits from the primary screen. Arrow denotes the result obtained with perphenazine (c). Representative images of DMSO (control) or perphenazine treated zebrafish larvae. (d) Dose response curve from secondary screen of perphenazine, with six zebrafish larvae treated per concentration. Drug doses higher than 10 µM induced general toxicity (not shown). Error bars = SD. (Modified and republished with permission from American Society for Clinical Investigation) [132]

