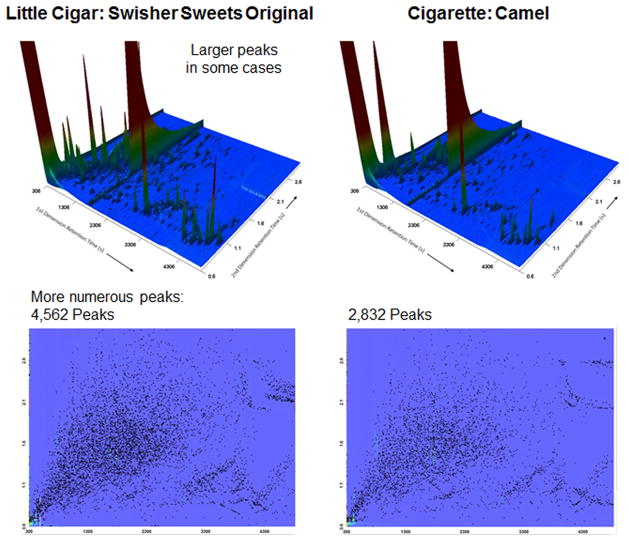
Figure 2.
Example GC×GC-TOFMS chromatograms for little cigar and cigarette samples. Top: Three-dimensional chromatograms, where x and y axes show retention times on first and second chromatographic columns, respectively, and z axis indicates combined responses from detected ions in mass spectra. Bottom: Two-dimensional chromatograms, where x and y axes show retention times on first and second chromatographic columns, respectively, and each dot indicates a peak, regardless of response.

