
Figure 1.
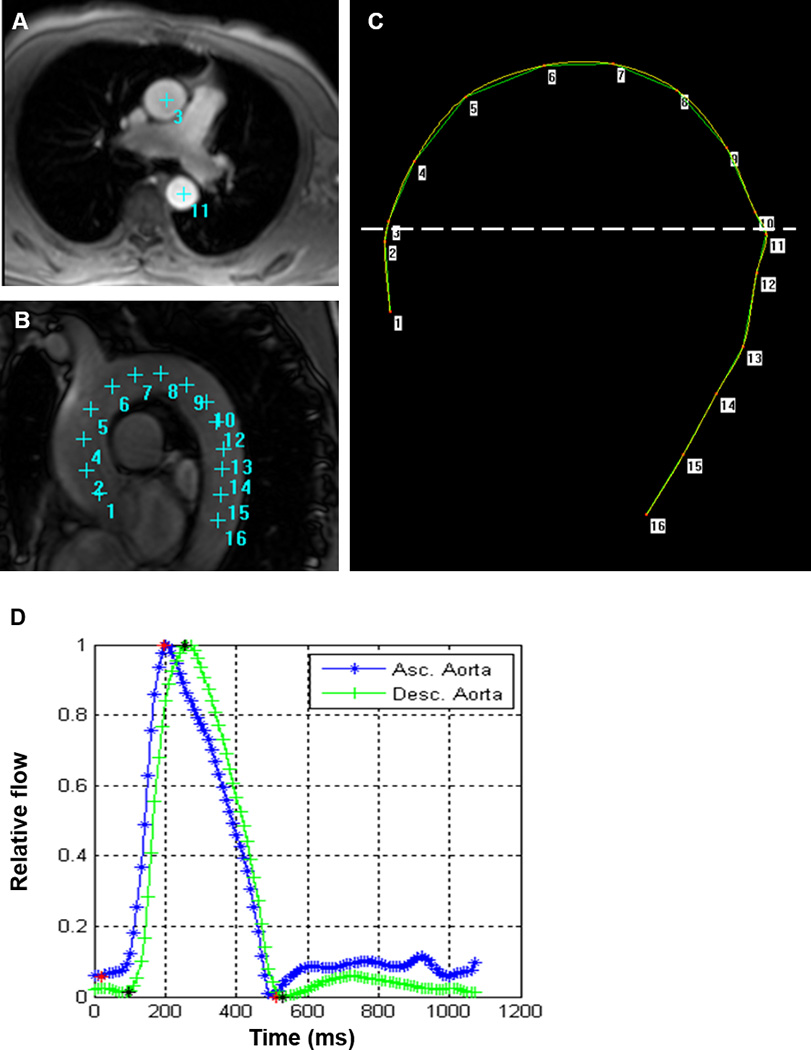
Measurement for aortic arch PWV. A: Phase contrast cine transverse view. B: Aortic arch view with SSFP sequence. C: Measurement of the transit distance in the aortic arch. Numbers correspond to those in A and B. Arch length is measured as the distance from 3 to 11 in this case. D: Flow wave curves of ascending (Asc.) aorta and descending (Desc.) aorta after peak flow normalization. Transit time is measured as the average time difference using the least squares estimate between all data points on the systolic upslope of the ascending and descending aortic flow curves. PWV is calculated as transit distance divided by transit time.