
Figure 3.
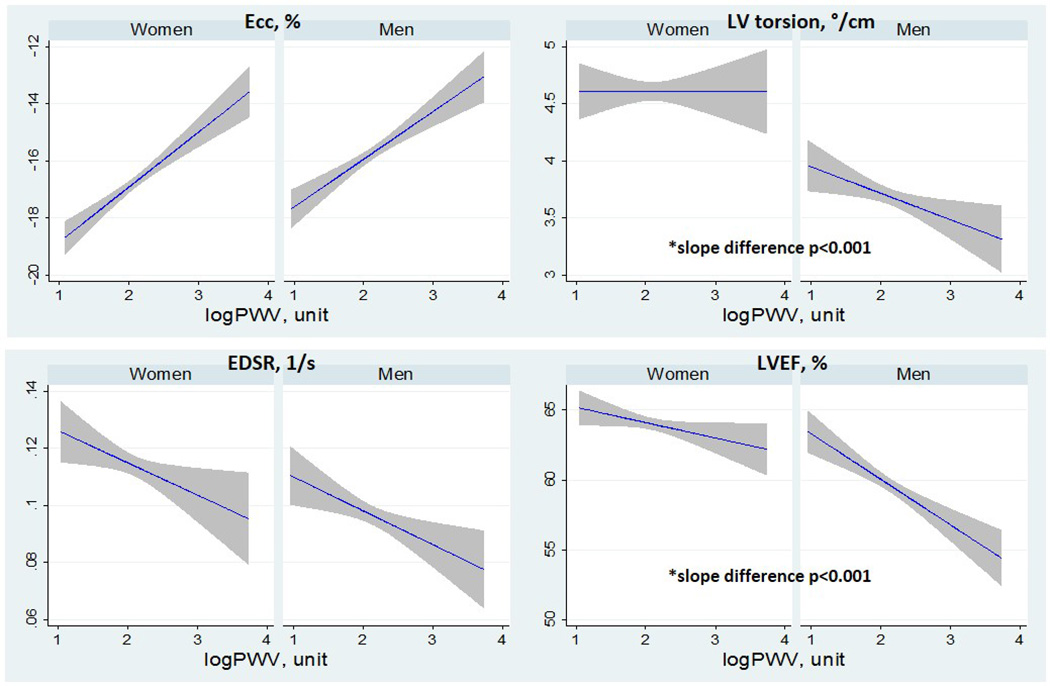
Plots showing linear regression fits with 95%CI for women and men with left ventricular (LV) function variables on the y axis and logPWV on the x. Abbreviation as Table 1.
Official websites use .gov
A
.gov website belongs to an official
government organization in the United States.
Secure .gov websites use HTTPS
A lock (
) or https:// means you've safely
connected to the .gov website. Share sensitive
information only on official, secure websites.
Plots showing linear regression fits with 95%CI for women and men with left ventricular (LV) function variables on the y axis and logPWV on the x. Abbreviation as Table 1.