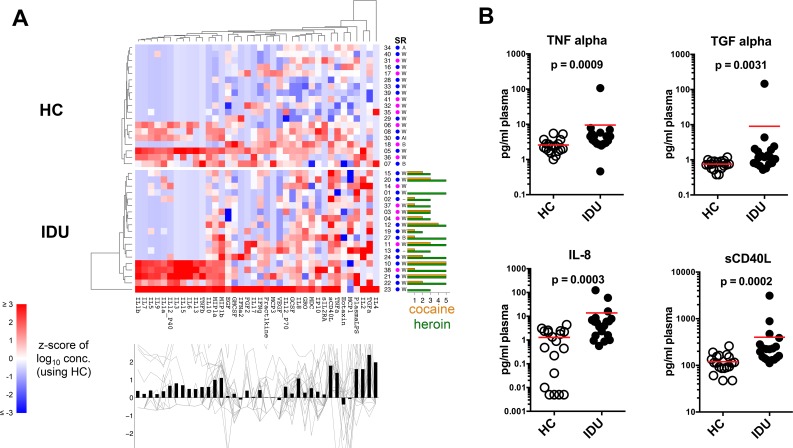
Fig 4. Plasma analyte profile.
Plasma cytokines, chemokines and growth factors were measured by Milliplex Immunoassay and LPS was measured by a limulus assay. (A) Analyte profiles are shown as a heat map similar to above. Analyte concentrations were log-transformed prior to computing z-scores. (B) Select plots of individual analytes, each symbol represents an individual subject, the red lines indicate mean.

