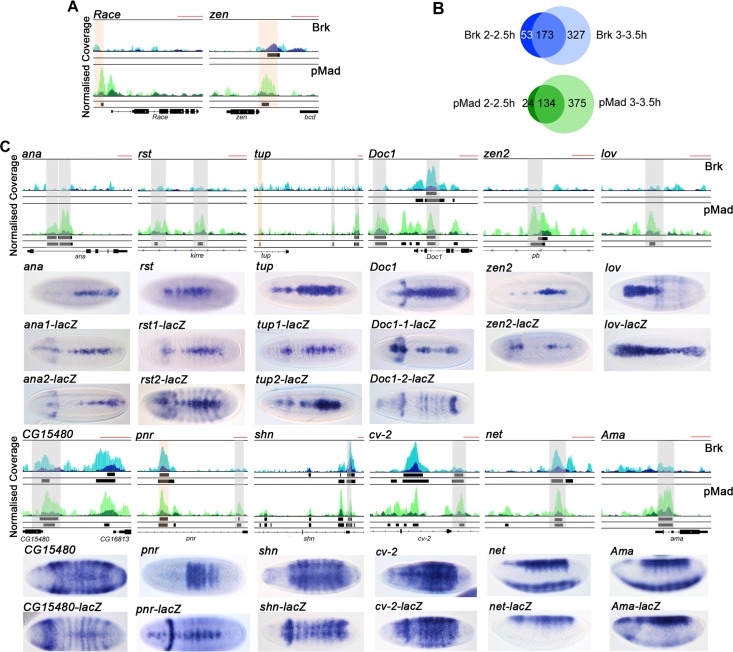
Fig 2. pMad and Brk ChIP-seq validation.
(A) Browser images of ChIP-seq reads normalized to the PI control for pMad (dark green, 2–2.5 h, light green, 3–3.5 h AEL) and Brk (dark blue, 2–2.5 h, light blue, 3–3.5 h AEL) for Race and zen. Called peaks are shown as black bars below the Brk and pMad tracks (top row 2–2.5 h, bottom row 3–3.5 h). The red scale bar at the top right of each browser view represents 1kb. Known enhancers are shaded in orange. (B) Venn diagrams showing the overlap between the data sets for each factor between the two time points. (C) Browser views as in (A) for putative enhancers based on pMad/Brk binding. In situ hybridizations below the browser views show the endogenous expression pattern for the indicated gene, and the lacZ reporter gene expression pattern driven by the test ChIP region. Embryos are dorsal views with the exception of the net and Ama embryos, which are shown as lateral views to highlight that the test region only drives the dorsal ectoderm part of the expression pattern. Grey shaded areas indicate the tested enhancer fragments, orange shading indicates a known enhancer. Where two are tested, the regions are labelled 1 and 2 as seen from left to right. The enhancer for zen2 is located within the pb gene. The absence of a gene structure below the tracks reflects distal enhancer positioning.

