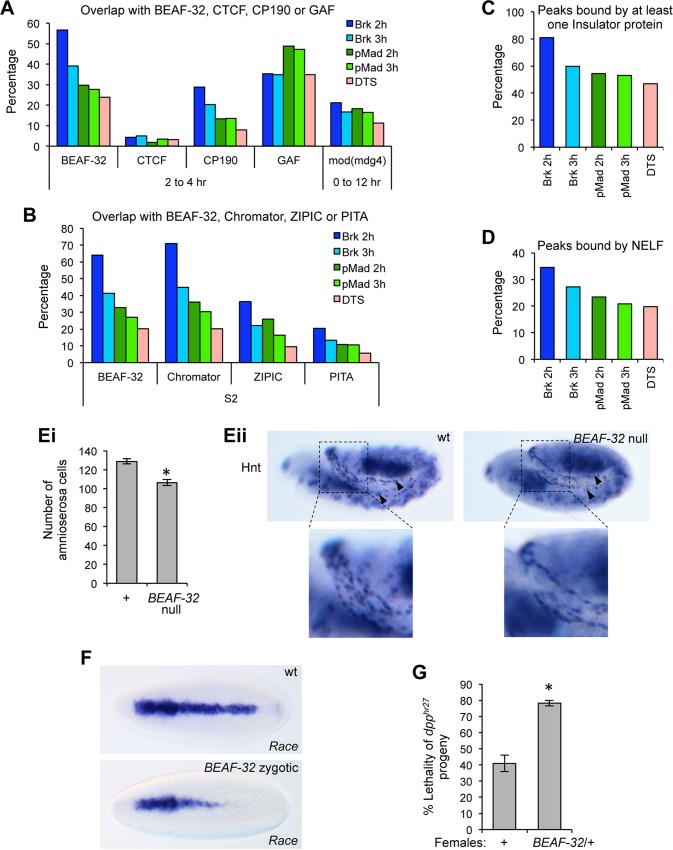
Fig 7. Insulator proteins bind to the pMad/Brk regions.
(A, B) Graphs showing percentage overlaps between the pMad/Brk ChIP peaks and the indicated insulator proteins using ChIP data obtained from 2–4 h or 0–12 h embryos (A) or S2 cells (B), as labeled. In graphs (A-B), regions within the DTS data set that overlap with pMad/Brk peaks were removed prior to calculating the DTS-insulator binding protein overlap, in order to provide a cleaner comparison with the pMad/Brk data. However, this removal typically only lowers the overlap between the DTS data sets and the insulator binding proteins by less than 3%, with the exception of the Chromator-DTS overlap that is reduced by 9%. (C) Graph showing the percentage of ChIP peaks in each data set that bind at least one of the insulator proteins tested in (A, B) with the exception of GAF and using only the embryo data for BEAF-32. (D) Graph showing overlap with NELF-B and NELF-E binding based on ChIP data obtained for these factors in S2 cells. (E) Graph (Ei) showing the number of amnioserosa cells, as determined by Hnt staining, in wildtype and BEAFAB-KO null embryos (n = 30 across 3 biological repeats, error bars are SEM, *p<0.01, two tailed t-test). Representative embryos are shown in (Eii), amnioserosa staining is indicated by black arrowheads, magnified views of the regions in the dashed squares are shown. (F) RNA in situ hybridizations showing a loss of posterior Race expression in embryos collected from BEAFAB-KO heterozygous adults, compared to wildtype. (G) Graph showing the percentage lethality of dpphr27 progeny from a cross of either wildtype or BEAF32ABKO/+ females to dpphr27/CyO males (n = 3, >200 flies counted for each biological repeat, error bars show SEM, *p<0.05, two tailed t-test).

