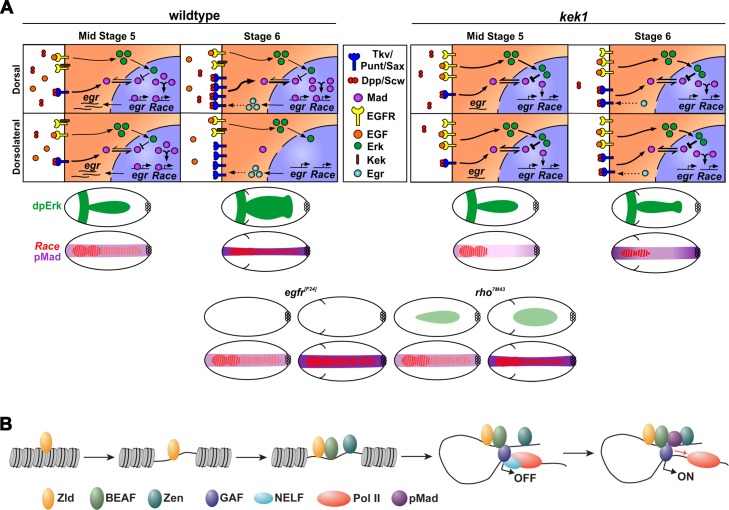
Fig 8. Models of pMad-dpERK antagonism and pMad activation.
(A) Model showing the equilibrium between the positive and negative effects of Dpp and EGF, respectively, on pMad. The top panels show dpERK-pMad dynamics in a wildtype or kek1 mutant cell at the dorsal midline (labeled Dorsal) compared to one positioned more dorsolaterally (Dorsolateral) at stages 5 and 6, as labelled, with the various proteins indicated in the key. The dpERK-pMad equilibrium is disrupted in kek1 mutant embryos leading to reduced pMad. For each stage and genotype, the resulting dpERK, pMad and Race activation/expression domains within the whole embryo are depicted in the lower cartoons. Cartoons (stages as described above) are also shown for the EGF loss-of-function mutants tested. (B) Stepwise model of pMad-dependent activation, involving Zld, Zen and insulator binding proteins.

