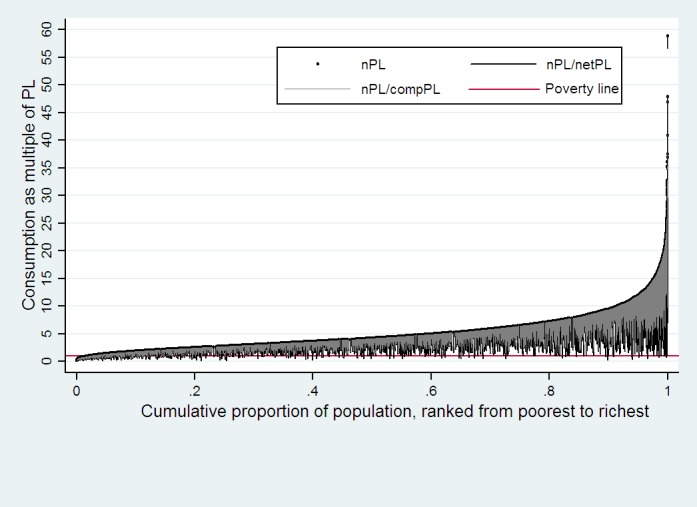
Fig 1. Effect of health payments and NCMS compensation on Pen’s parade of the household consumption distribution for whole NCMS insured.

The black vertical not covered by the grey vertical represents the consumption reducing from NCMS compensation. When the black bar crosses the poverty line and the grey bar goes back above the poverty line, it represents the poverty alleviation by the NCMS.
