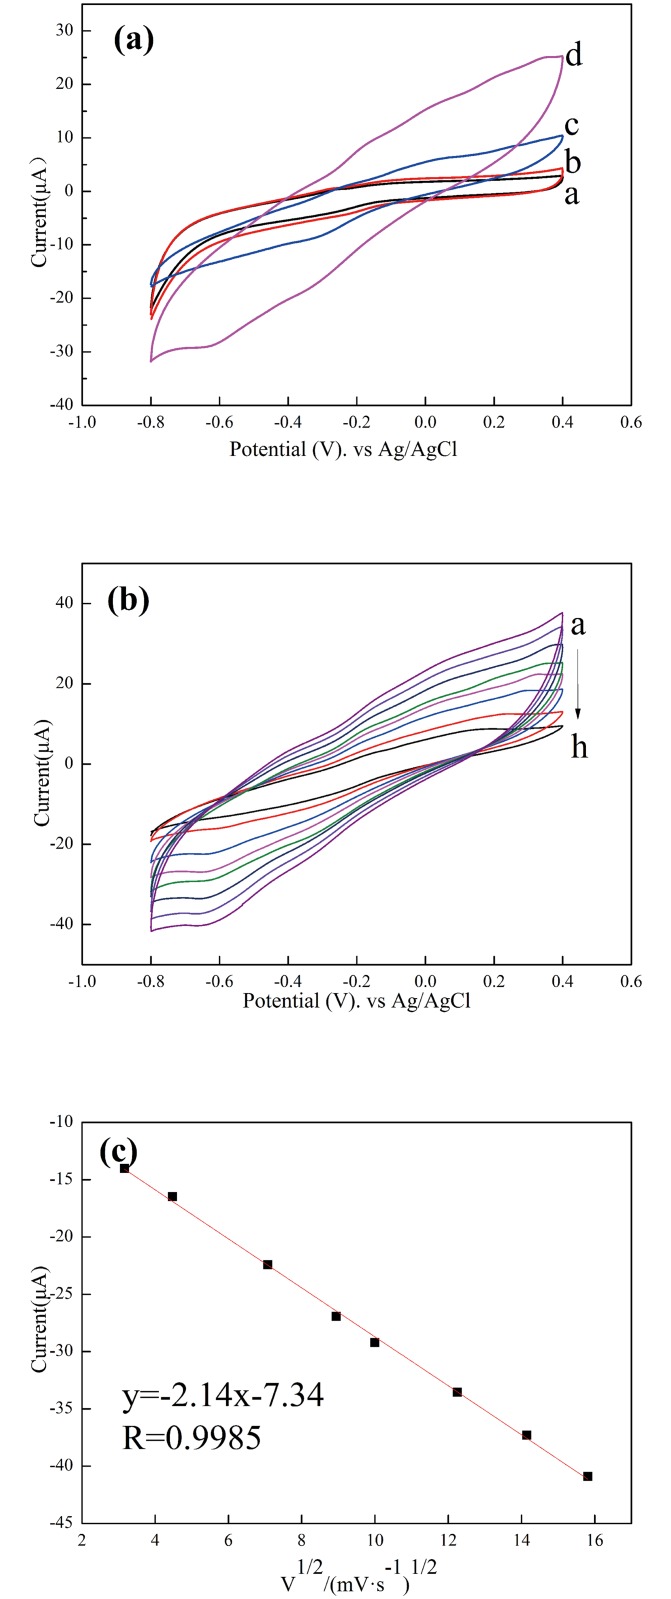
Fig 3.
(a) Cyclic voltammograms of GO/PDA sensor (a and b) and GO/PDA/Cu NPs/GCE sensor (c and d) in the absence (a and c) and presence (b and d) of 10 mM H2O2 at a scanning rate of 100 mV/s in 0.1 M pH 7.2 PBS. (b) Cyclic voltammograms of the GO/PDA/Cu NP sensor in 0.1 M pH 7.2 PBS containing 10 mM H2O2 at different scan rates (V) of 10, 20, 50, 80, 100, 150, 200 and 250 mV/s (from a to h). (c) Plots of the response peak current vs. the square root of the scan rate (V1/2). Results are presented as mean ±SD (error bar) of triplicate experiments.

