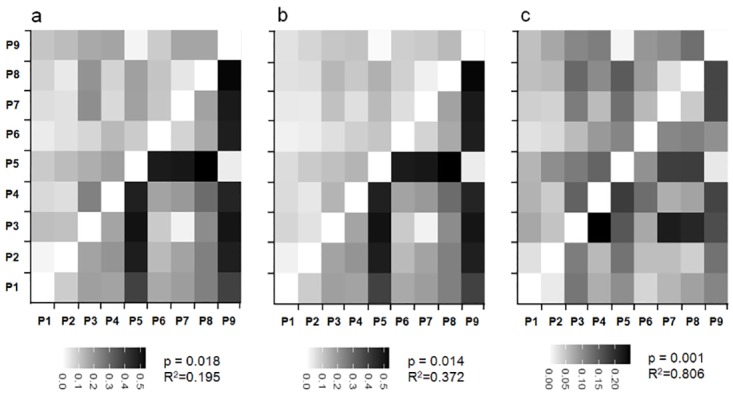
Fig 2. Pairwise ΦST and ΦCT among the 9 populations in CK and OS conditions and their correlations.

a) Correlation between pairwise ΦST of epigenetic data in CK (upper) and pairwise ΦCT of genetic SSR data (below). b) Correlation between pairwise ΦST of epigenetic data in OS (upper) and pairwise ΦCT of genetic SSR data (below). c) Correlation between pairwise ΦST of epigenetic data in OS (upper) and in OS (below). The p values and R squares indicate the correlations via Mantel tests.
