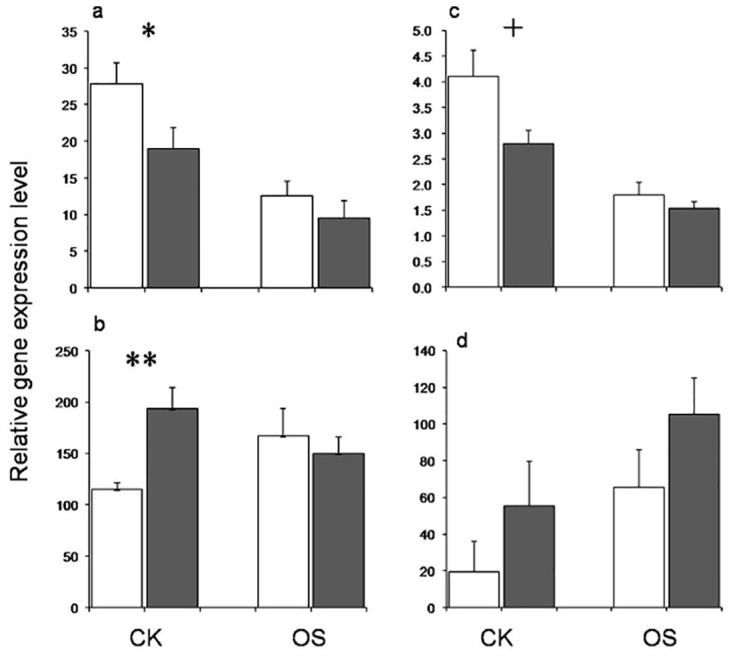
Fig 3. Relative expression levels of genes of highly divergent epiloci in CK and OS conditions.

a) LOC_Os05g18604; b) LOC_Os12g44160; c) LOC_Os05g38400; d) LOC_Os02g06160.White bar indicates gene expression in lowland rice while black bar indicates gene expression in upland rice. Error bars indicate standard errors. ‘*’ and ‘+’ indicate the levels of significance of p<0.05 and p<0.10 between upland and lowland rice ecotypes.
