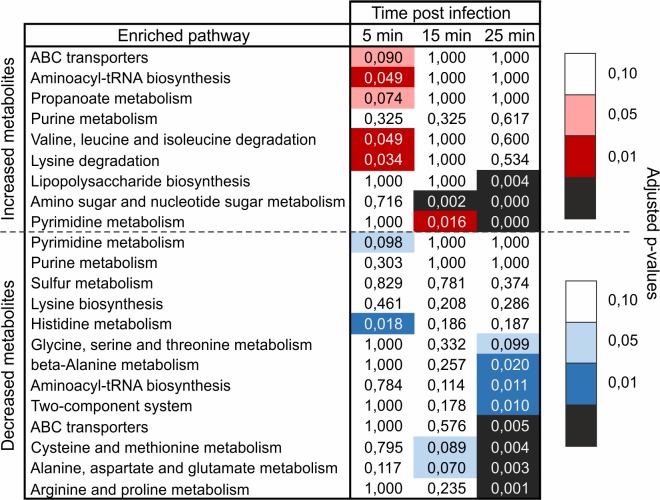
Fig 5. Pathway enrichment analysis during PAK_P3 infection revealed its requirement on pyrimidine metabolism.
Values of the enrichment analysis are shown for the significantly enriched pathways (rows) at the different time points (columns). The color scale indicates the cut-off for the p-values, where red and blue are used for, respectively, the pathways found enriched among increased and decreased metabolites.

