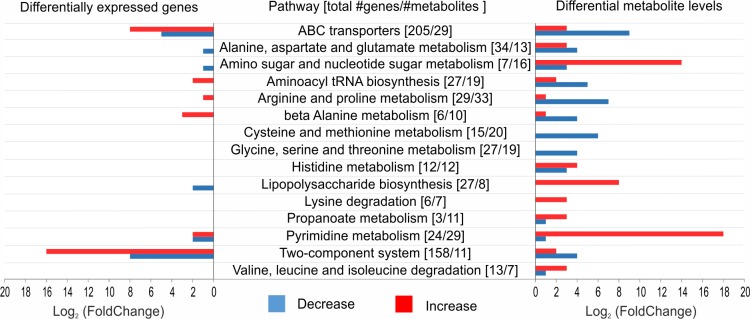
Fig 6. Comparison of significant changes in transcriptomics and metabolomics data from PAK_P3 infected cells reveals no direct correlation.
On the left, the number of genes with a significant differential expression (│Log2(fold change)│ > 1.3, p-value < 0.05) is shown. On the right, an overview of the number of metabolites with significantly changed levels (│Log2(fold change)│ > 0.5, p-value < 0.05) is shown. The middle column entails all studied metabolic pathways and indicated between brackets are, respectively, the total number of genes and metabolites involved in this pathway. Red = increase in transcript/metabolite level, Blue = a decrease in transcript/metabolite level.

