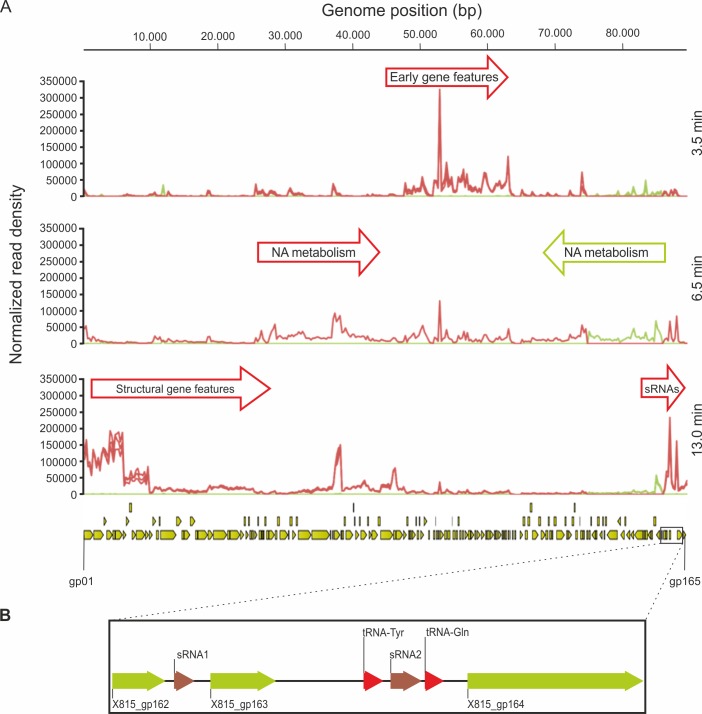
Fig 7. PAK_P3 transcription is temporally regulated.
(A) Mapped reads were summarized into stranded count tables of Total Gene Reads that align to every 250bp of the PAK_P3 genome using the CLC Genomics Workbench. These read counts were then normalized against each other by the Total Count of reads that align to both phage and host genomes for each sample and then plotted. This allows us to show the relative abundance of phage transcripts over time in the context of the total transcript population. Red and green graphs represent reads mapping to the forward and reverse strands, respectively, for each replicate in each condition. The PAK_P3 genome is represented at the bottom of the panel with yellow arrows indicating defined coding sequences. (B) Enlargement of the PAK_P3 genome region encoding small RNAs. NA = nucleic acid

