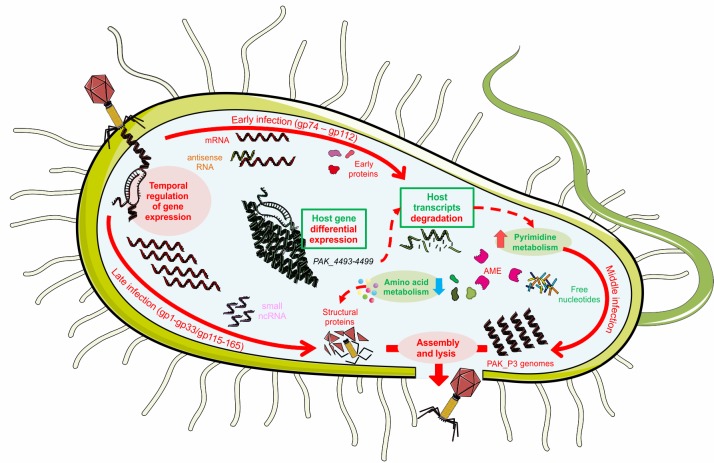
Fig 8. Molecular details of PAK_P3 infection cycle of P. aeruginosa strain PAK.
Red and green colors correspond to phage and host elements respectively. A description of the figure is given in the text (see Discussion). Full arrows depict the three temporal stages of PAK_P3 infection cycle. Dashed arrows represent relations between metabolic pathways highlighted by our “-omics” analyses. AME = Auxiliary Metabolic Enzymes.

