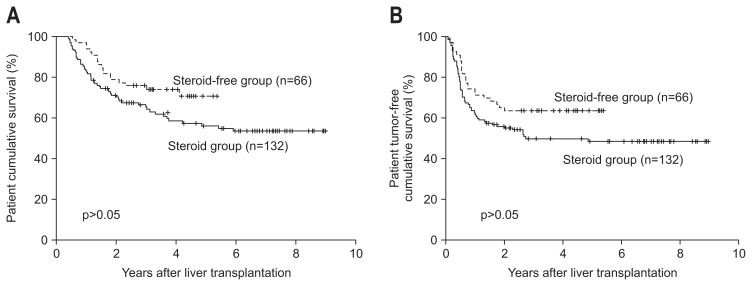
Fig. 2.
Between-group comparison of the cumulative patient (A) and tumor-free (B) survival rates. Differences in the overall survival curves of patients in the steroid-free group and patients in the steroid group did not achieve statistical significance (1-year, 83.3% vs 97.0%; 3-year, 65.4% vs 75.8%; 5-year, 56.3% vs 70.7%, respectively; p=0.067 for all). Additionally, the difference in the tumor-free survival curves of patients in the steroid-free group and patients in the steroid group did not reach the level of statistical significance (1-year, 62.1% vs 72.7%; 3-year, 49.8% vs 63.6%; 5-year, 48.6% vs 63.6%, respectively; p=0.067 for all).

