Figure 2.
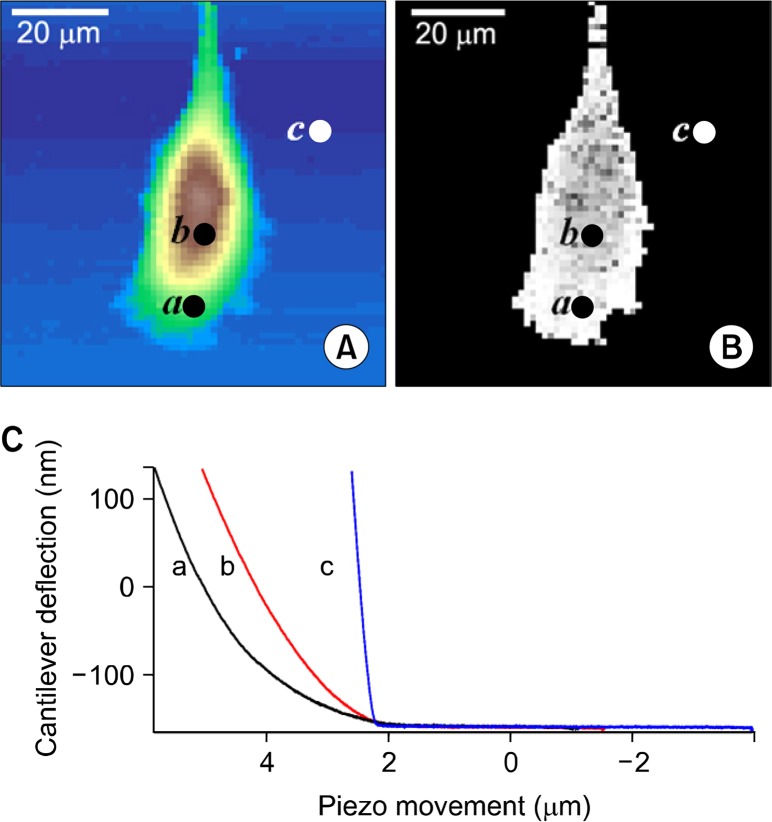
The representative maps of topography and elastic constants determined from force-distance (f-d) curves obtained in two-dimensional arrays. Presented (C) f-d curves were obtained from the points indicated as a (cell edge), b (cell center), c (glass) in the (A) topographic and (B) elastic maps. The horizontal axis represents the z-sensor (μm) showing the atomic force microscopy (AFM) z-piezo movements while the vertical axis represents the cantilever deflection (nm) of the AFM probe. The 64 × 64 f-d curves were obtained from the area of 80 × 80 μm2 area.

