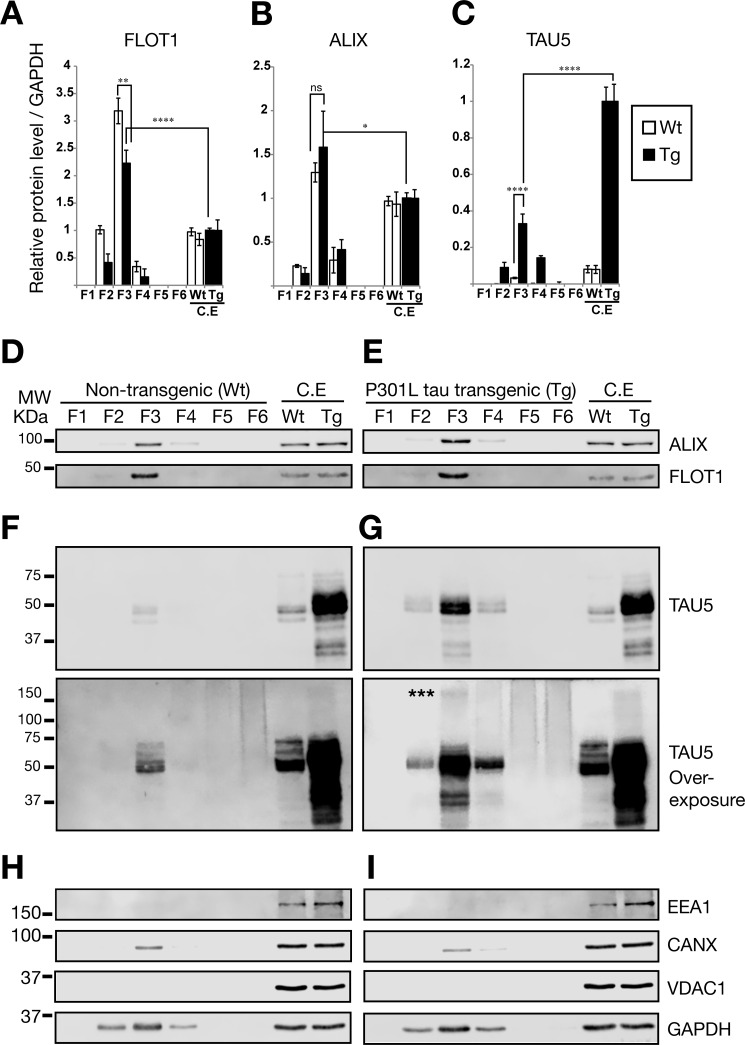
FIGURE 2.
Analysis of protein contents in isolated EVs. Shown are quantitative Western blotting analysis of FLOT1, ALIX, and TAU expression. The same amount of protein (20 μg) was loaded for F3 EVs and whole control cell extracts (C.E). Error bars represent S.E. (n = 3). *, p < 0.05; **, p < 0.01; ****, p < 0.0001. A, quantification of protein levels for FLOT1, showing a very strong enrichment. B, protein levels for ALIX, an exosome marker of the endocytic pathway, were also enriched. C, quantification of protein levels for total tau. D–I, representative Western blots for different sucrose fractions of exosome isolations from WT and Tg mice, showing ALIX and FLOT1 expression (D and E) as well as total tau (mouse and human) detected with the Tau5 antibody (F and G). Note the bottom panels (F and G) for Tau5 overexposure, revealing high molecular weight (MW) proteins in F3, stronger around 150 kDa (asterisks), indicating potential trimers of tau in EVs. F5 and F6 show a continuous high molecular weight smear, indicating that some of the aggregates visualized by transmission electron microscopy (Fig. 1) could be free tau aggregates, which sediment at high concentrations of sucrose (59). H and I, detection of markers for cytoplasmic organelles in the sucrose fractions of exosome-like EVs: mitochondrial (VDAC1), early endosome (EEA1), and endoplasmic reticulum markers (calnexin) were tested.

