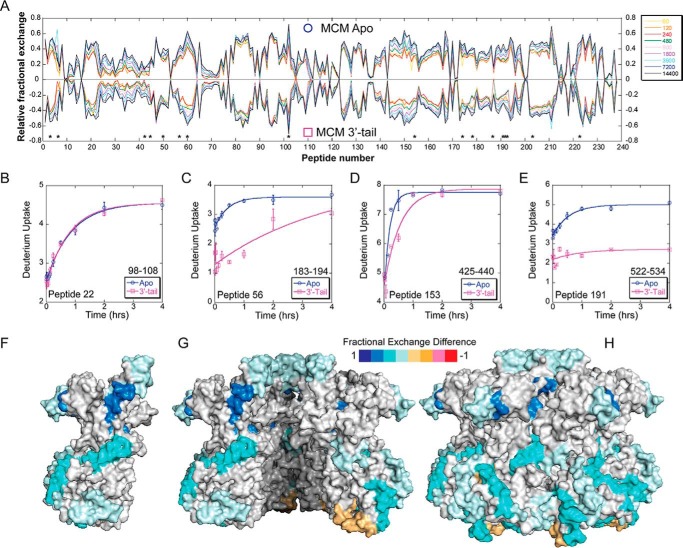
FIGURE 4.
HDX of apo-SsoMCM versus SsoMCM with 3′-tail DNA substrate. A, butterfly plot of SsoMCM (○, positive values) and SsoMCM and 3′-tail DNA (□, negative values) relative fractional exchange versus peptide number. *, peptides with significant differences. B–E, deuterium incorporation during the H/D exchange period for four representative peptides, including one with no significant change (B) and three others (C–E) with significant differences between the two conditions (○, apo, blue; □, 3′-tail, pink). Time course deuterium incorporation levels were generated by an MEM fitting method as described under “Experimental Procedures.” Peptide regions with significant deuterium uptake differences are mapped on the surface of SsoMCM, highlighting monomer (F), the interior channel (cutaway of top two subunits) (G), and the exterior surface (H).

