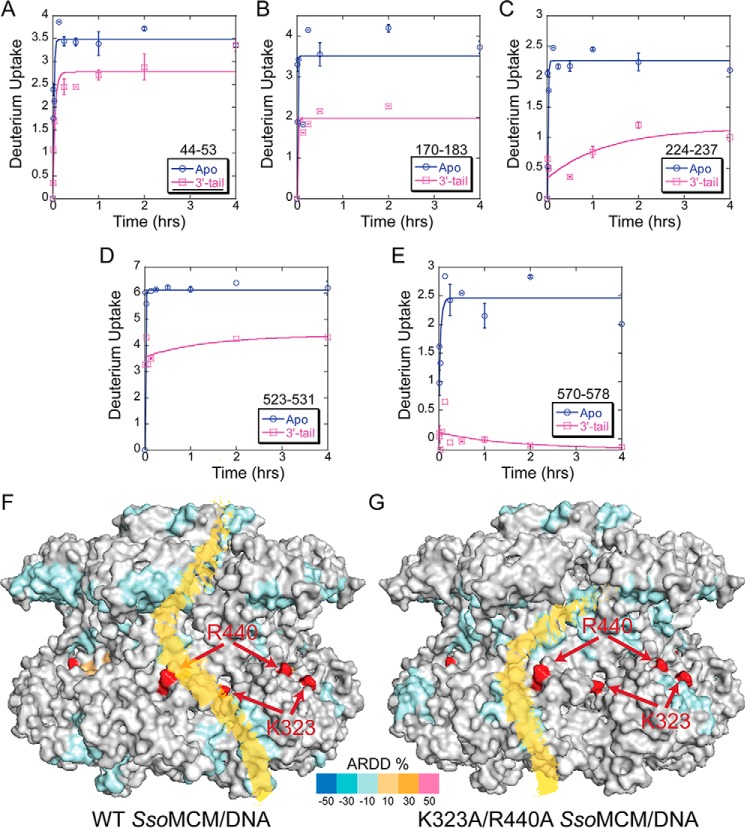
FIGURE 7.
ARDD of WT SsoMCM versus K323A/R440A bound to DNA. A–E, representative deuterium uptake profiles for SsoMCM (K323A/R440A) peptides with significant differences between apo- and 3′-tail DNA substrate. Time course deuterium incorporation levels were generated by an MEM fitting method, as described under “Experimental Procedures.” F and G, ARDD between apo-WT SsoMCM (F) and K323A/R440A (G) and 3′-tail DNA bound and mapped onto the surface. Red residues indicate the positions of Lys323 and Arg440. A putative external ssDNA binding path is altered between WT and K323A/R440A, as indicated in yellow. Error bars, S.E.

