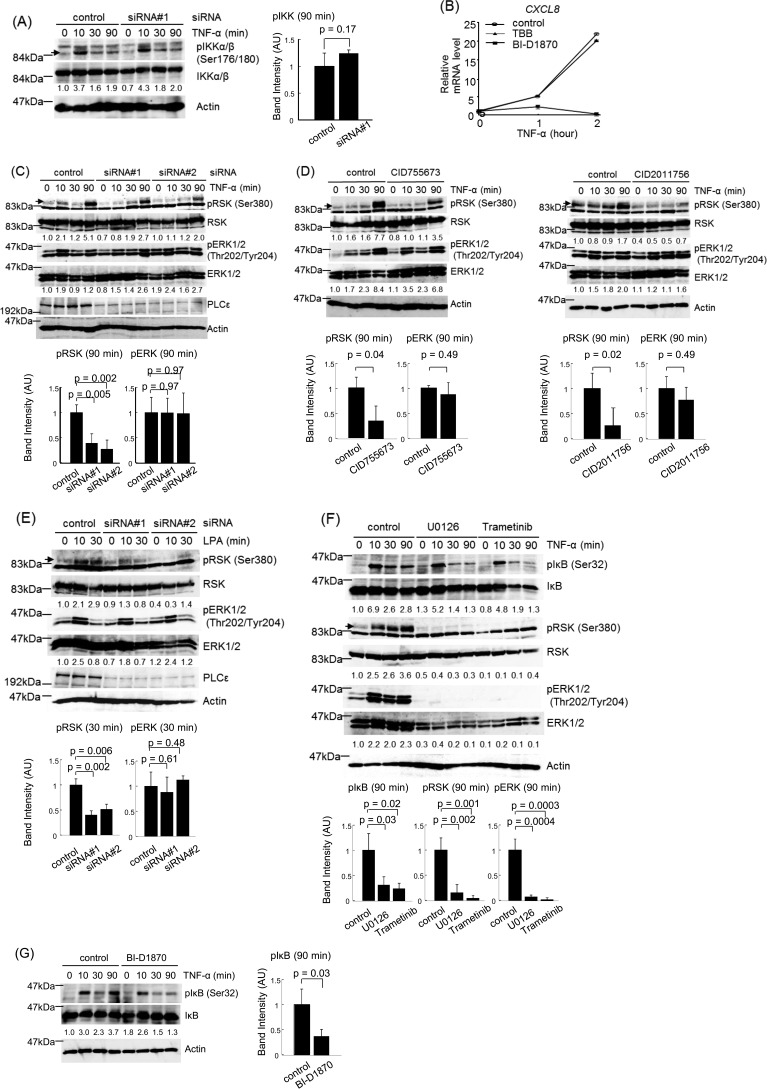
FIGURE 6.
Role of RSK in PLCϵ-dependent IκB phosphorylation. A, Caco2 cells transfected with the indicated siRNAs were cultured for 38–42 h, serum-starved for 3 h, and stimulated with 20 ng/ml TNF-α for the indicated times. IKKα/β phosphorylated at Ser-176 and Ser-180, total IKKα/β, and actin in the cell lysates were detected by immunoblotting with the anti-phospho-IKKα/β, anti-IKKα/β, and anti-actin Abs, respectively. The numbers below the immunoblots indicate -fold changes of the phospho-IKK signals divided by the total IKK signals over that at 0 min after TNF-α stimulation of the control cells. The averages of the intensities of the immunoreactive signals of phospho-IKKα/β at 90 min of three independent experiments are expressed as the mean ± S.D. (error bars) in arbitrary units (AU) with p values (right). B, Caco2 cells were serum-starved for 3 h, treated with 10 μg/ml BI-D1870 or 28 μg/ml TBB for 30 min, and stimulated with 20 ng/ml TNF-α for the indicated times. The CXCL8 mRNA levels were measured as described in the legend to Fig. 5A. C, Caco2 cells were treated with the indicated siRNAs and stimulated with TNF-α as described in A. RSK phosphorylated at Ser-916 and total RSK in the cell lysates were detected by immunoblotting with the anti-phospho-RSK and anti-RSK Abs, respectively. ERK1/2 phosphorylated at Thr-202 and Tyr-204 and total ERK1/2 were detected by immunoblotting with the anti-phospho-ERK and anti-ERK Abs, respectively. PLCϵ and actin were detected by immunoblotting with the anti-PLCϵ and anti-actin Abs, respectively. The numbers below the immunoblots indicate -fold changes of the signals of the phosphorylated proteins divided by the signals of the total proteins over those at 0 min after TNF-α stimulation of the control cells. The averages of the intensities of the immunoreactive signals of the indicated phosphoproteins at 90 min of three independent experiments are expressed as the mean ± S.D. in arbitrary units with p values (bottom). D, Caco2 cells were serum-starved for 3 h, treated with 10 μg/ml CID755673 or 50 μm CID2011756 for 30 min, and stimulated with 20 ng/ml TNF-α for the indicated times. The phosphorylations of RSK and ERK1/2 were measured as described in C. The averages of the intensities of the immunoreactive signals of the indicated phosphoproteins at 90 min of three independent experiments are expressed as the mean ± S.D. in arbitrary units with p values (bottom). E, Caco2 cells were serum-starved for 3 h, treated with the indicated siRNAs, and stimulated with 50 μm LPA for the indicated times. The phosphorylations of RSK and ERK1/2 were measured as described in C. The averages of the intensities of the immunoreactive signals of the indicated phosphoproteins at 30 min of three independent experiments are expressed as the mean ± S.D. in arbitrary units with p values (bottom). F, Caco2 cells were serum-starved for 3 h, treated with 10 μg/ml U0126 or 10 μm trametinib in combination with 10 μm MG-132 for 30 min, and stimulated with 20 ng/ml TNF-α for the indicated times. IκB phosphorylation was measured as described in the legend to Fig. 3B, and the phosphorylations of RSK and ERK1/2 were measured as described in C. The averages of the intensities of the immunoreactive signals of the indicated phosphoproteins at 90 min of three independent experiments are expressed as the mean ± S.D. in arbitrary units with p values (bottom). G, Caco2 cells were serum-starved for 3 h, treated with 10 μg/ml BI-D1870 and 10 μm MG-132 for 30 min, and stimulated with 20 ng/ml TNF-α for the indicated times. IκB phosphorylation was measured as described in the Fig. 3B legend. Three experiments performed independently yielded equivalent results. The averages of the intensities of the immunoreactive signals of phospho-IκB at 90 min of three independent experiments are expressed as the mean ± S.D. in arbitrary units with p values (right).

