FIGURE 8.
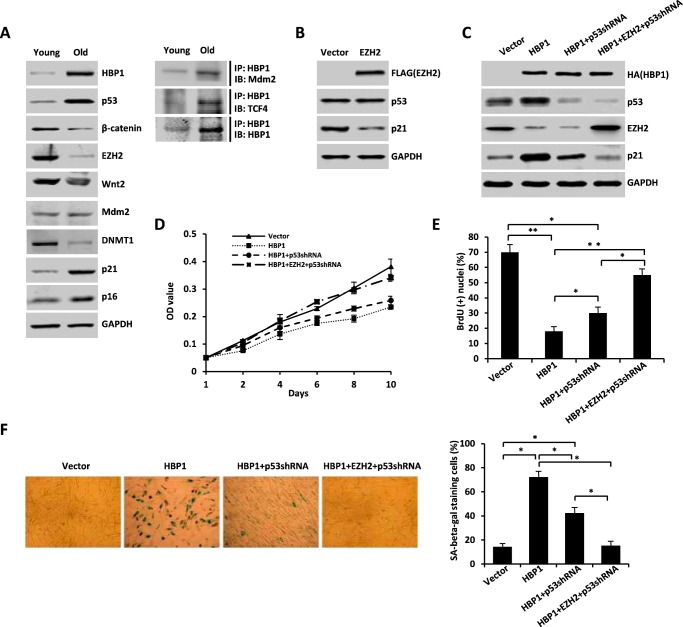
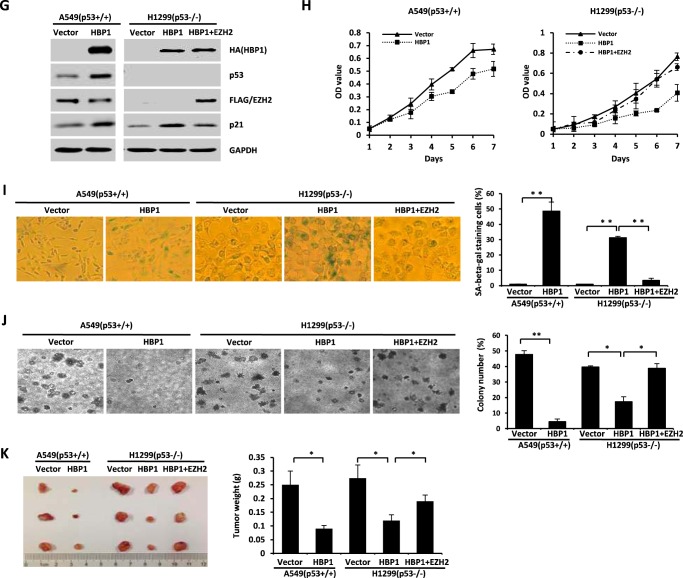
HBP1-mediated activation of p21 through the Mdm2/p53 and TCF4/EZH2 pathways contributes to HBP1-induced premature senescence and tumor inhibition. A, the protein levels of HBP1, p53, EZH2, and p21 during replicative senescence. Shown is an immunoblot (IB) of WI-38 cells in young and old stages. The expression of endogenous HBP1, p53, β-catenin, EZH2, Wnt2, p21, and p16 is shown. GAPDH was used as a loading control (left panel). WI-38 cells were lysed with IP lysis buffer and then subjected to immunoprecipitation with anti-HBP1 antibody followed by Western blotting analysis with anti-Mdm2 and anti-TCF4 antibodies (right panel). B, exogenous EZH2 inhibits p21 expression. The protein levels of EZH2, p53, and p21 were measured by immunoblotting in WI-38 cells (PD20) retrovirally transduced with EZH2 or control vector. C, EZH2 attenuates HBP1 elevation of p21 when p53 is knocked down by shRNA. The levels of EZH2, p53, p21, and GAPDH (as a control) were determined by Western blotting of WI-38 cells retrovirally transduced with control vector, HBP1, HBP1 + p53shRNA, or HBP1 + EZH2 + p53shRNA. D and E, EZH2 attenuates HBP1-induced cell growth arrest when p53 is knocked down by shRNA. MTT (D) and BrdU (E) incorporation assays were conducted with WI-38 cells retrovirally transduced with control vector, HBP1, HBP1 + p53shRNA, or HBP1 + EZH2 + p53shRNA. The means ± S.E. for three independent experiments are shown. OD, optical density. *, p < 0.05; **, p < 0.01. F, EZH2 attenuates HBP1-induced premature senescence when p53 is knocked down by shRNA. WI-38 cells (PD20) were retrovirally transduced with control vector, HBP1, HBP1 + p53shRNA, or HBP1 + EZH2 + p53shRNA. Cells were then stained for SA β-gal on day 14 after transduction (left panel). The percentage of cells positive for SA β-gal in WI-38 cells was determined in three independent experiments and expressed as mean ± S.E., with 300 cells/experiment. *, p < 0.05 (right panel). G, EZH2 attenuates HBP1 elevation of p21 in the absence of p53. Levels of EZH2, p53, p21, and GAPDH (as a control) were determined by Western blotting of A549 cells retrovirally transduced with control vector or HBP1 or H1299 cells retrovirally transduced with control vector, HBP1, or HBP1 + EZH2. H, EZH2 attenuates HBP1-induced growth inhibition. A549 and H1299 cells were stably transfected with either control vector, HBP1, or HBP1 + EZH2. After puromycin or G418 selection, the growth rates of cells were measured by MTT assay. The mean ± S.E. for three independent experiments are shown. I, EZH2 attenuates HBP1-induced premature senescence. A549 and H1299 cells stably transfected with either control vector, HBP1, or HBP1 + EZH2 were subjected to an SA β-gal staining assay (left panel). The percentage of cells positive for SA β-gal was determined in three independent experiments and expressed as mean ± S.E., with 300 cells/experiment. **, p < 0.01 (right panel). J, soft agar colony formation assay of A549 and H1299 cells stably transfected with control vector and HBP1 or HBP1 + EZH2. Cells were cultured in soft agar for 2 weeks (left panel). The colony numbers in three different microscope fields were counted and are shown as mean ± S.E. *, p < 0.05; **, p < 0.01 (right panel). K, A549 and H1299 cells stably transfected with control vector and HBP1 or HBP1 + EZH2 were subcutaneously injected into nude mice. Four weeks after injection, the tumors were weighed, and size was measured. Data are shown as mean ± S.E. (n = 3). *, p < 0.05.


