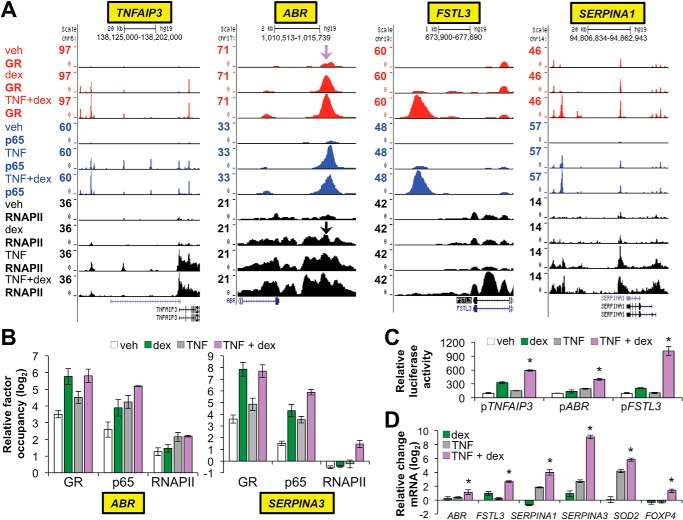
FIGURE 7.
Novel targets of cooperative regulation by GR and p65. A, GR (red), p65 (blue), and RNAPII (black) ChIP-seq peaks in Beas-2B samples treated as indicated on the far left and visualized in the UCSC Genome Browser at the TNFAIP3, ABR, FSTL3, and SERPINA1 loci. The purple arrow indicates the approximate location of ChIP primers used to validate GR and p65 occupancy (see panel B) upstream of ABR; black arrows indicate the location of the ChIP primers used to validate RNAPII occupancy. B, ChIP-qPCR analysis of GR, p65, and RNAPII occupancy within the ABR and SERPINA3 loci. Bars represent mean (±S.D.) relative factor occupancy on a log2 scale, as detailed for Fig. 5. RNAPII and GR/p65 ChIP-qPCR primers for SERPINA3 targeted the transcription start site and a region ∼10 kb upstream of the transcription start site, respectively. C, relative luciferase activity of the indicated reporter constructs after transfection into Beas-2B cells and treatment with vehicle, dex, TNF, or TNF + dex for 8 h. *, p ≤ 0.05 compared with the other treatments for each reporter. D, relative mRNA levels of the indicated genes in Beas-2B cells treated with vehicle, dex, TNF, or TNF + dex for 4 h. *, p ≤ 0.05 versus treatment with dex or TNF + dex for each gene as indicated.

