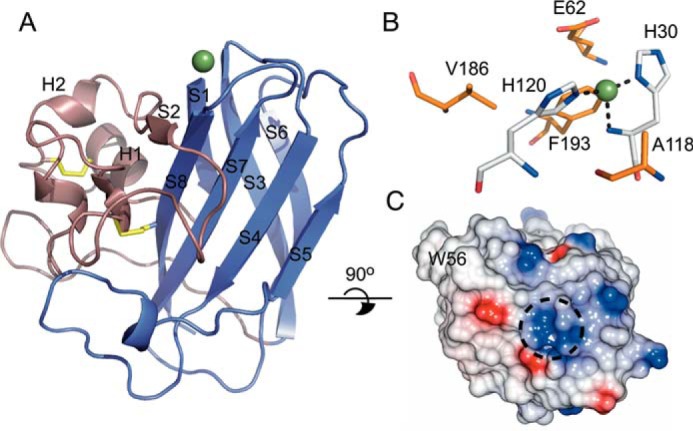
FIGURE 4.

X-ray crystal structure of SliLPMO10E. A, schematic representation with the core β-sheet fold shown in purple and the loop 2 region displayed in violet. Disulfide bonds are shown in yellow, and the copper represented as a sphere. B, stick representation of the active site. Coordinating His residues are colored in silver and residues surrounding the first copper coordination sphere shown in orange. Bonds to the copper ion are indicated by dashed lines. C, electrostatic surface representation of the proposed substrate-binding surface with W56 labeled and the location of the copper indicated by a dashed circle.
