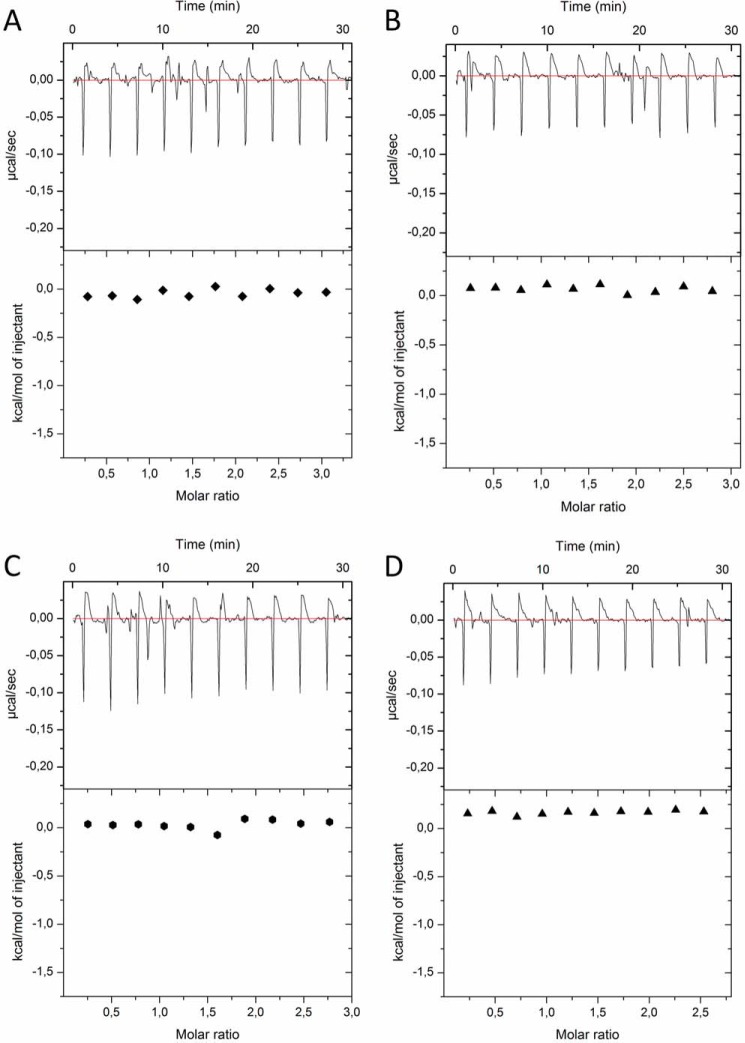
FIGURE 5.
ITC experiments between ZZ domain variants and SUMO1 variants. The experiments show the titrations of wild type ZZ domain (ZZwt) to the SUMO1 mutant 1 (SUMO1mut1) (A), ZZwt to SUMO1 mutant 2 (SUMOmut2) (B), ZZ domain mutant (ZZmut) to SUMO1mut1 (C), and ZZmut to SUMO1mut2 (D). The raw data of the experiments are presented on the top panel. The area underneath each injection peak is equal to the total heat released for that injection.

