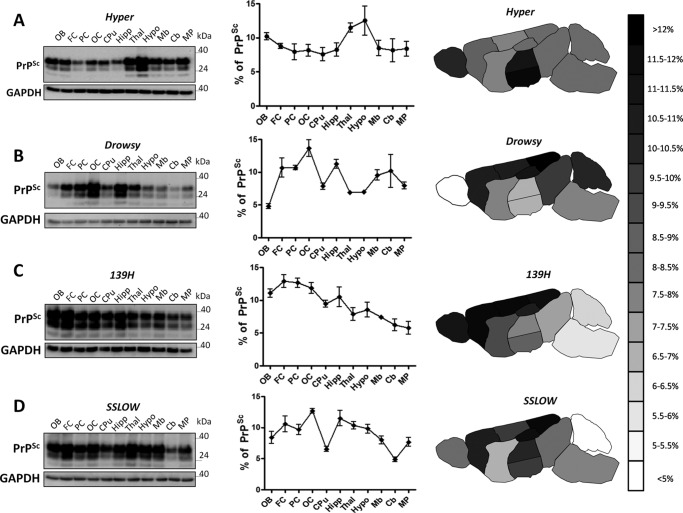
FIGURE 2.
Brain distribution of PrP27–30 in different hamster prion strains. Brain structures isolated from terminally ill Syrian hamster infected with HY (A), DY (B), 139H (C), and SSLOW (D) prions were tested for PrP27–30 levels by WB. Left panels show representative WBs for each strain. GAPDH was used to control protein load among the samples. Blots for GAPDH were independently run using the same volume as the experimental samples, but without PK digestion. Numbers on the right represent molecular weight standards. Graphs in the middle show the average distribution profile obtained from 3–5 different brains (each one tested at least in triplicates). All samples were PK treated before WB. Data are expressed as averages ± S.E. Continuous lines are used to highlight the different profiles of PrP27–30 accumulation for different strains. OB, olfactory bulb; FC, frontal cortex; PC, parietal cortex; OC, occipital cortex; CPu, caudate/putamen; Hipp, hippocampus; Thal, thalamus; Hypo, hypothalamus; Mb, midbrain; Cb, cerebellum; MP, medulla/pons; MW, molecular weight standard. The schematic drawing in the right side represent a heat map of PrP27–30 distribution throughout different brain regions. Data are represented from >12% (darker signal) to <5% (lighter signal). Color scale is graded in 0.5% intervals.

