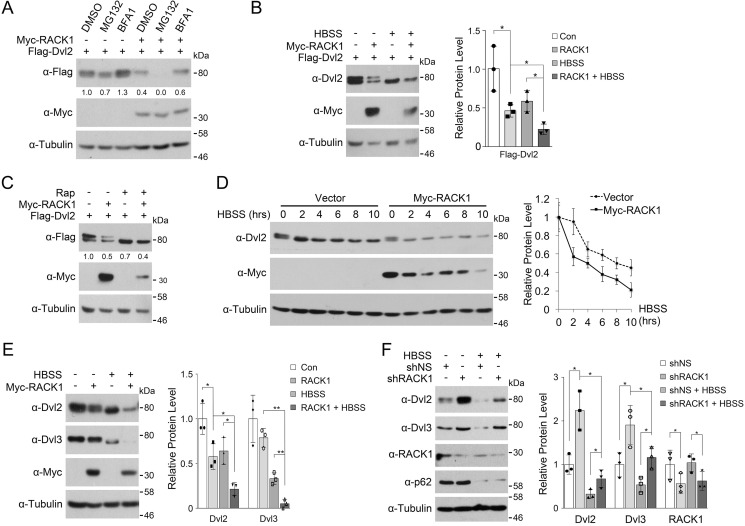
FIGURE 4.
RACK1 facilitates starvation-induced Dvl2 degradation. A, HEK293T cells transfected with FLAG-Dvl2 and Myc-RACK1 as indicated were treated with the proteasome inhibitor MG132 (10 μg/ml) or the lysosome inhibitor BFA1 (0.2 μm) for 6 h before being harvested for immunoblotting. The protein levels of FLAG-Dvl2 were quantified and normalized against tubulin, and the values are shown below the bands. B, HEK293T cells were transfected with FLAG-Dvl2 and Myc-RACK1. After 24 h, they were starved in HBSS for 6 h before being harvested for immunoblotting. Three independent experiments were conducted for quantification analyses. The protein levels of FLAG-Dvl2 were quantified and normalized against tubulin, and the data are represented as mean ± S.D. in the right panel. Two-tailed unpaired t test was used in statistical analyses (*, p < 0.05). Con, control. C, HEK293T cells were transfected with Myc-RACK1 and FLAG-Dvl2. After 24 h, the cells were treated with rapamycin (Rap, 2 mm) for 6 h before being harvested for immunoblotting. The protein levels of FLAG-Dvl2 were quantified and normalized against tubulin, and the values are shown below the bands. D, HEK293T cells were transfected with Myc-RACK1. After 24 h, the cells were starved in HBSS for the indicated times before being harvested for immunoblotting. Three independent experiments were conducted for quantification analyses. The protein levels of Dvl2 were quantified and normalized against tubulin, and the data are represented as mean ± S.D. in the right panel. E, HEK293T cells were transfected with Myc-RACK1. After 24 h, they were starved in HBSS for 6 h before being harvested for immunoblotting. Three independent experiments were conducted for quantification analyses. The protein levels of Dvl2 and Dvl3 were quantified and normalized against tubulin, and the data are represented as mean ± S.D. in the right panel. Two-tailed unpaired t test was used in statistical analyses (*, p < 0.05 ; **, p < 0.01). F, HEK293T cells were infected by a lentivirus expressing nonspecific or RACK1 shRNA. After 48 h, cells were starved in HBSS for 6 h before being harvested for immunoblotting. p62 served as an autophagy marker. Three independent experiments were conducted for quantification analyses. The protein levels of Dvl2, Dvl3, and RACK1 were quantified and normalized against tubulin, and the data are represented as mean ± S.D. in the right panel. Two-tailed unpaired t test was used in statistical analyses (*, p < 0.05).

