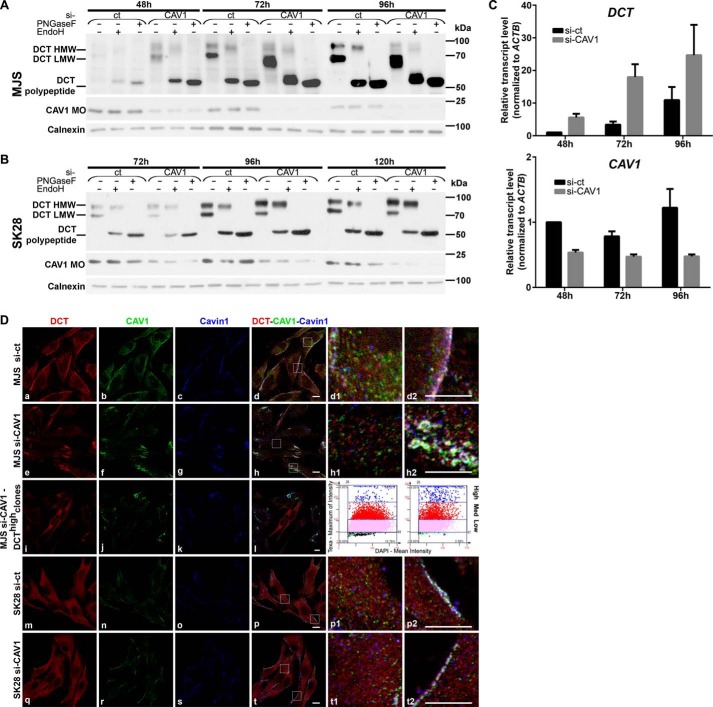
FIGURE 5.
CAV1 silencing has distinct impact on DCT expression, maturation, and subcellular distribution in early and metastatic melanoma cell phenotypes. A and B, DCT processing in si-CAV1 cells. MJS (A) and SK28 (B) cells sub-confluent (48 and 72 h), semi-confluent (72 and 96 h), and confluent (96 and 120 h) cultures in si-ct and si-CAV1 experiments were analyzed for DCT (with D18) by deglycosylation treatments with EndoH and PNGase F and CAV1 MOs (with α-CAV1-CS) in WB. Calnexin was used as loading control. C, DCT mRNA expression determined by real time RT-qPCR in MJS cells (panel DCT) upon silencing of the CAV1 gene (panel CAV1). Graphs show average of experiments (n = 6 replicates for each cell line and time point); error bars represent S.E. D, subcellular distribution of DCT, CAV1, Cavin-1 in MJS (72 h), and SK28 (96 h) si-ct and si-CAV1 cells assessed by triple staining DCT (red), CAV1 (green), and Cavin-1 (blue) in immunofluorescence confocal microscopy. The propensity of DCThigh cell clones upon si-CAV1 treatment assessed by TF quantitative image cytometry (3rd panel, blue dots on left scattergram, si-ct; on right scattergram, si-CAV1). Last columns represent enlarged details of merged images. Scale bar, 10 μm. Images were acquired using ×63 oil immersion objective. Each experiment is a representative one of three.

