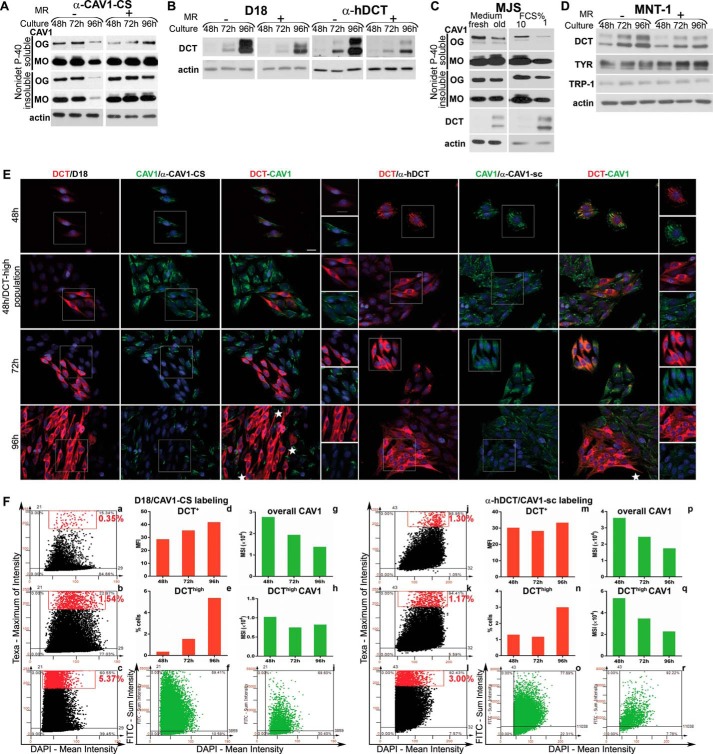
FIGURE 7.
DCT and CAV1 expressions are oppositely modulated by environmental and cellular factors in MJS phenotype. A and B, MJS cells were plated and cultured for 48, 72, or 96 h, and in one experiment the culture medium was replenished with a fresh one every 24 h (MR+) or not changed during the indicated time periods (MR−). C, MJS cells cultured for 24 h were incubated with fresh culture medium (fresh) or with medium resulting from a 96-h (old) culture for an additional 24 h (left panel); MJS cells were cultured for 72 h in culture medium with 10 or 1% FCS (right panel). D, MJS and MNT cells were cultured and treated for the indicated time periods as described for A and B. For all experiments, the Nonidet P-40- soluble and Nonidet P-40-insoluble fractions of the MJS cell lysates were analyzed by WB for the expression of CAV1 (with α-CAV1-CS), DCT (with D18 or α-hDCT), TYR (with α-Pep7h), and TRP-1 (with αPep1h). Actin was used as loading control. Each experiment is a representative one of three. E, DCT (red) and CAV1 (green) distribution in cell populations during sub-confluent (48 h) to semi-confluent (72 h) and confluent (96 h) transition assessed by immunofluorescence microscopy. Last columns represent enlarged details of separate images. The antibody combinations for DCT and CAV1 immunostaining are indicated in each panel. Images were acquired using ×40 objective. Scale bar represents 20 μm. Each experiment is a representative one of three. F, image cytometry analysis of triple labeled (DCT/CAV1/nuclei with the two antibody combinations and DAPI) samples performed using the TF system. MFI and MSI were determined for DCT and for CAV1 expression, respectively. For each staining, DCT expression scattergrams for 48 h (upper left), 72 h (middle left), and 96 h (lower left) are gated to select cells with high marker expression (upper right quadrant represents cells positive for DCT, and the rectangle delineates the gated DCThigh cell subpopulation, shown as red dots). For the 96-h time point, CAV1 scattergrams of all cells (bottom middle) as compared with DCThigh cell subpopulation (bottom right) were generated. Values representing mean expression for DCT and CAV1 as well as % of cells in DCThigh subset were derived from Tissue Quest data statistics and are represented as graphs. One representative experiment of two performed is shown.

