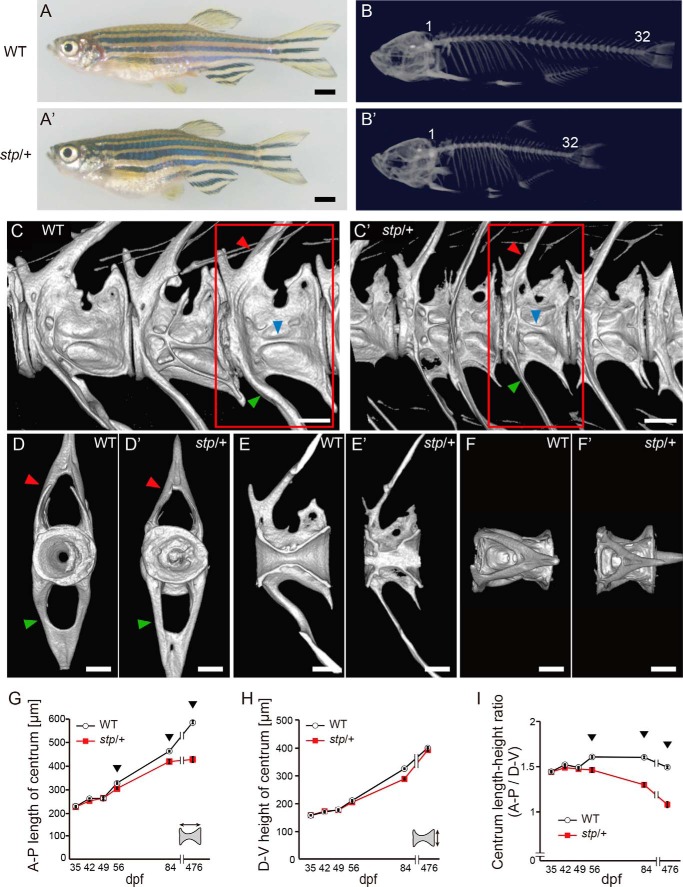
FIGURE 1.
stp vertebral phenotype. Panels show adult fish (A and A′), CT scans of their skeletons (B–F and B′–F′), and graphs of vertebral growth rate (G–I). B and B′, the numbers indicate vertebra identity along the AP axis. The stptl28d/+ fish had the same number of vertebrae as their wild type siblings (n = 6). C and C′, the red square indicates the third caudal vertebra. Arrowheads point to neural arches (red arrowheads), hemal arches (green arrowheads), and beam-like structures (blue arrowheads) on the centrums. D and D·, front views of the third vertebra. Abnormal calcification was seen in the inside of the centrum in stptl28d/+ fish. It was also seen in the wild type fish, but calcification was more severe in the stptl28d/+ fish. E and E′, sagittal images from the left side. F and F′, views from the top. G, centrum length at each time point. H, centrum DV height at each time point. I, centrum length to height ratio. G–I, the data shown are mean values from five vertebrae, the first through the fifth caudal vertebrae (n = 6). Arrowheads point to time points at which the stp vertebral phenotype was seen. Error bars, S.E. Scale bars, 1000 μm in A and A′ and 250 μm in C–F and C′–F′. stp/+, stptl28d/+.

