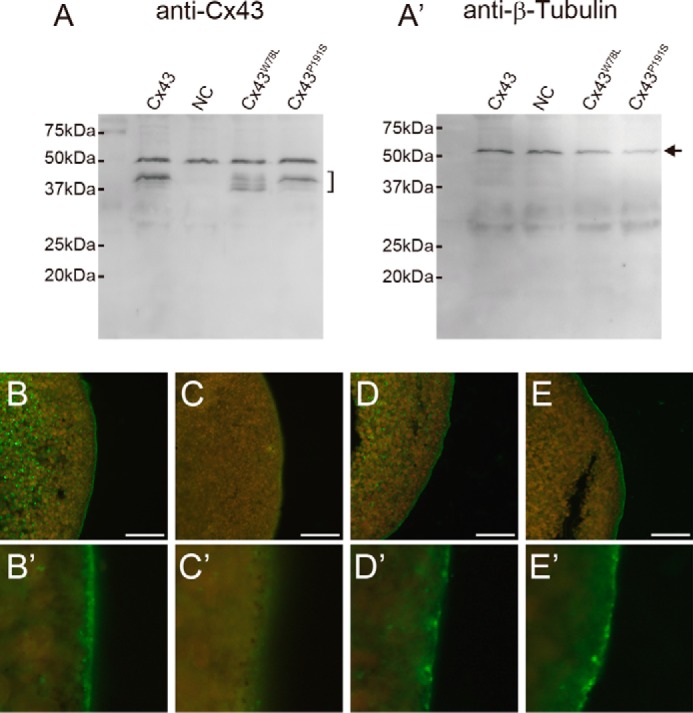
FIGURE 9.

Protein expression. Protein expression and membrane localization in Xenopus oocytes were analyzed by Western blotting (A and A′) and immunofluorescence staining (B–E and B′–E′). A, bracket indicates Cx43 bands detected by anti-Cx43 antibody. Bands at ∼50 kDa are nonspecific labeling. A′, arrow indicates β-tubulin bands (positive control). mRNA for each connexin was injected into Xenopus oocytes along with an antisense oligonucleotide for Xenopus cx38. NC, negative control (only antisense oligonucleotide for Xenopus cx38 was injected). B–E, membrane localization of Cx43 or its mutants was detected. B, wild type Cx43. C, negative control. D, Cx43W78L (Cx43stp). E, Cx43P191S (Cx43sof). B′–E′, magnified images of B–E, respectively. Scale bars, 50 μm.
