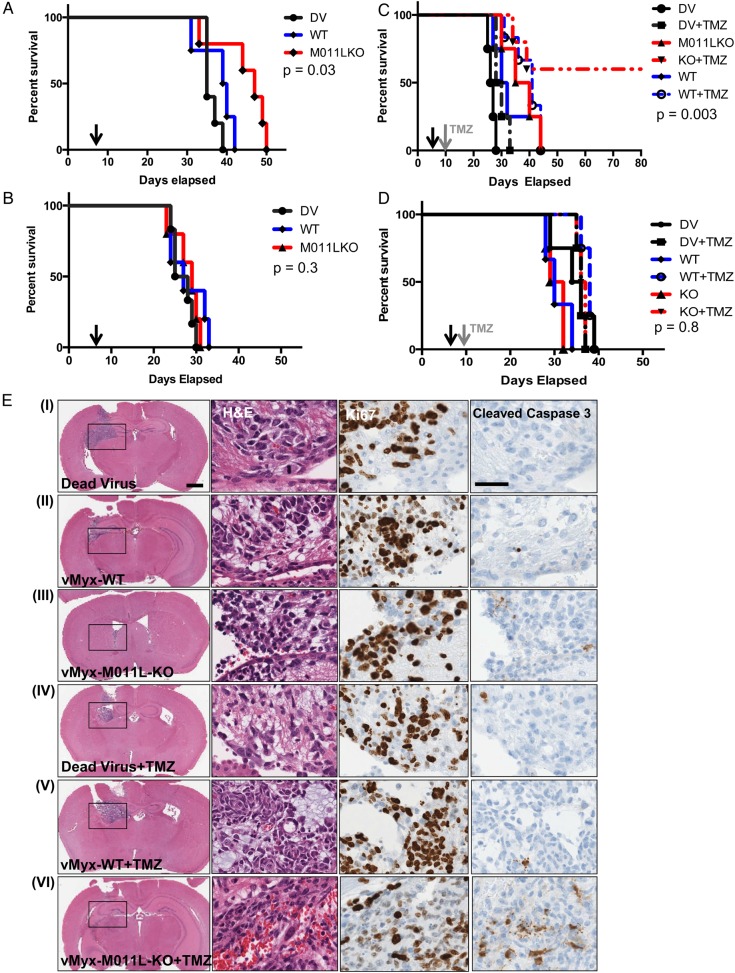
Fig. 4.
vMyx-M011L-KO prolongs survival of immunocompetent mice bearing syngeneic gliomas and results in long-term survival in combination with temozolomide (TMZ). Kaplan-Meier survival curve of mBTIC0309-bearing immunocompetent C57BL/6 mice (A) or immunodeficient NOD SCID gamma mice (B) treated with 5 × 10⁶ foci-forming units (FFUs) of vMyx-WT, vMyx-M011L-KO or UV-inactivated MYXV. Five mice were randomly assigned to each experimental group, and a single intratumoral virus injection was performed on day 7 after tumor implantation (black arrow). Statistical significance (P = .03, compared with vMyx-WT or dead virus, for C57BL/6J mice, (A) was determined using log-rank Mantel-Cox test. (C) Kaplan-Meier survival curve of mBTIC0309-bearing C57BL/6J mice treated with 5 × 10⁶ FFUs of vMyx-WT, vMyx-M011L-KO, or UV-inactivated MYXV in combination with TMZ. Ten mice were randomly assigned to each experimental group, and a single intratumoral virus injection was performed on day 7 after tumor implantation. Half of the animals were treated with 100 mg/kg of TMZ (grey arrow) on day 10 after tumor implantation (day 3 after virus treatment) for 5 consecutive days. Statistical significance (P < .007, vMyx-M011L-KO compared with dead virus, and P < .003, combination of TMZ and vMyx-M011L-KO compared with combination of TMZ and dead virus) was determined using log-rank Mantel-Cox test. No statistical significance (P = .8) in median survival was observed in immunocompromised animals treated in combination with TMZ (D). The data represent results from at least 2 independent experiments with similar results. (E) Immunohistochemical analysis 14 days after tumor inoculation (7 days after MYXV and 5 days after TMZ treatment). The tumor size was reduced in vMyx-M011L-KO + TMZ group (VI). Scale bar 2 mm. Combination treatment with vMyx-M011L-KO, and TMZ led to significantly (P < .05, Supplementary Material, Fig. S14) stronger cleaved caspase 3 staining, indicating increased apoptotic cell death in vivo. Scale bar 200 µm. Slides shown are representative of similar observations in 2 different mice receiving same treatment regimen.

