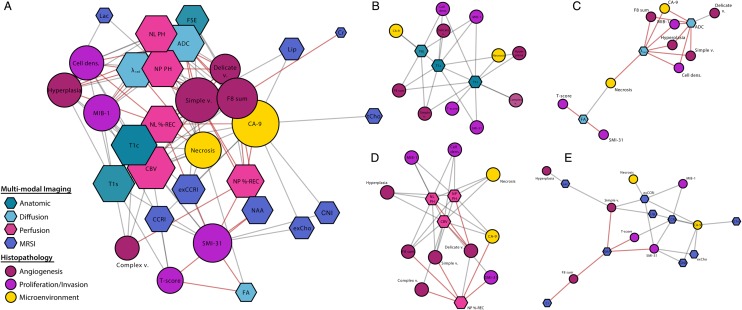
Fig. 5.
Network linkage map of histopathology and advanced imaging of image-guided tissue samples. Nodes were color coded using meta-labels of angiogenesis, proliferation/invasion, and microenvironment for histopathology parameters as well as by modality for imaging parameters. Node size corresponds with average shortest path length. Imaging nodes are presented as hexagons and histopathology nodes as circles. Although imaging and histopathology parameters were intracorrelated, only edges between histopathology and imaging were generated for clarity of network visualization. Red connections denote negative correlation.

