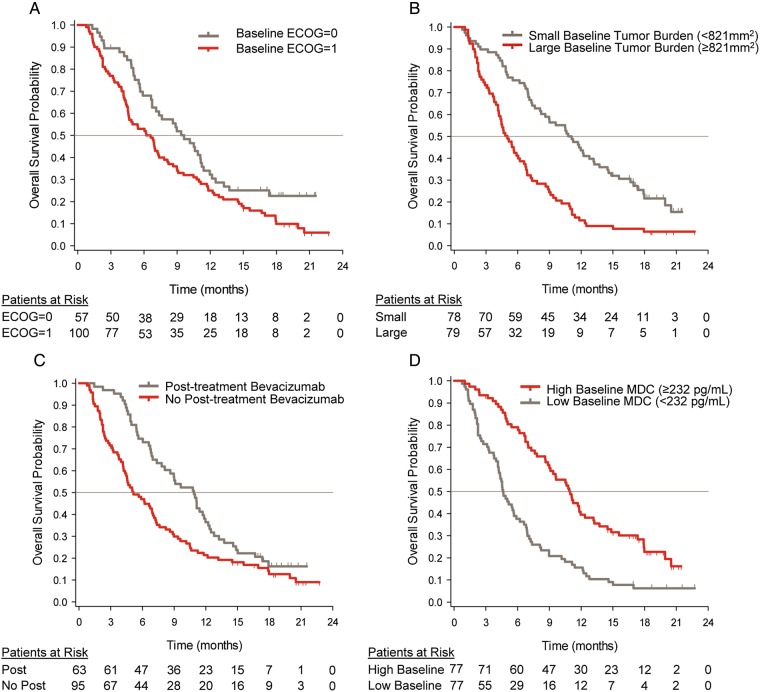
Fig. 3.
Kaplan-Meier curves for overall survival by baseline prognostic factors. (A) ECOG PS; (B) tumor burden; (C) bevacizumab; (D) MDC levels. “Patients at risk” denote the number of patients who were event-free at the beginning of the period. Continuous factors (baseline tumor burden and baseline MDC levels) were split into 2 groups at the median. The median baseline tumor burden was 821 mm2, and the median baseline MDC was 232 pg/mL.

