Fig. 3.
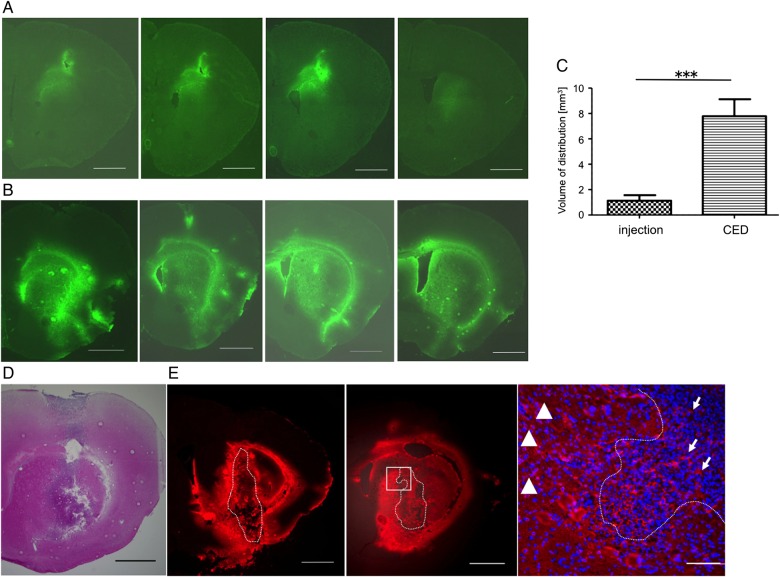
Distribution of FGK45 in mouse brain parenchyma (A, B, and C) and in mouse brain tumor model (D and E). After direct injection (A) or convection-enhanced delivery (CED) (B) of FGK45, fluorescent staining for FGK45 (green) detected the distribution of FGK45 in mouse brain parenchyma. Sequential sections from representative mouse brain are shown. The mean Vd of CED (n = 5, 7.788 ± 0.4316 mm3) was significantly robust compared with that of direct injection (n = 5, 1.126 ± 1.126 mm3) (C). Bars indicate mean ± SE. Student t test ***P < .0001. In bRiTs-G3 model 5 days after tumor cell implantation (D, H&E stain), extensive and diffuse distribution of FGK45 (red) after CED were detected in tumor bed as well as in surrounding brain parenchyma (E, left and middle; sequential slices with 100 µm interval). Enlarged image of the white rectangular box in middle panel (E, right). Dotted lines indicate tumor margin. Scale bars in A, B, D, and E (left and middle) indicate 1000 µm, and in E (right) indicate 100 µm. Arrows indicate FGK45 distribution inside the tumor, and arrowhead depicts that in surrounding brain parenchyma.

