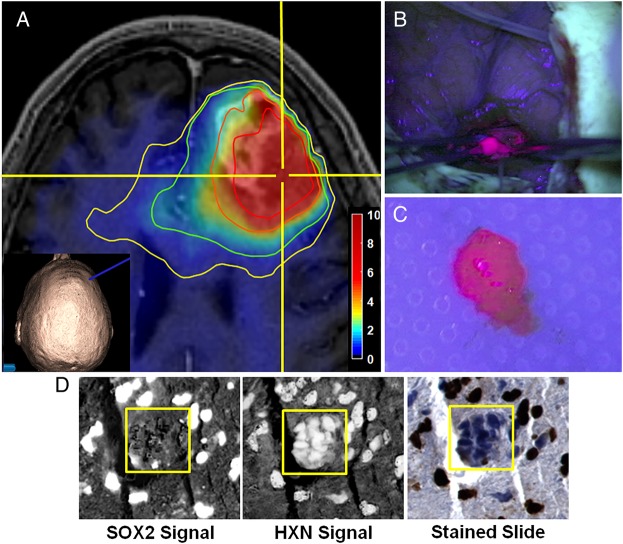
Fig. 1.
Procedure for tissue sampling and histological analysis using sMRI and 5-ALA FGS. (A) View of anatomical and metabolic data in neuronavigation station with Cho/NAA ratio contours (yellow, 1.5-fold; green, 2-fold; orange, 5-fold; red, 10-fold increases in Cho/NAA over normal contralateral white matter). The inset image shows the 3D reconstruction of the patient surface anatomy along with the navigation probe (blue). (B) The region of metabolic abnormality was identified using a stereotactic technique with a location-reporting probe, and fluorescence was visualized using intraoperative microscopy. (C) Tissue was sampled in a biopsy-like fashion before debulking, and fluorescence was measured ex vivo. (D) Automated nuclear segmentation, digital unmixing (pictured), and nuclear classification using machine-learning techniques allowed the generation of a Sox2 density metric that was correlated with sMRI and ex vivo fluorescence signal. HXN, hematoxylin. Color bar depicts fold changes.

