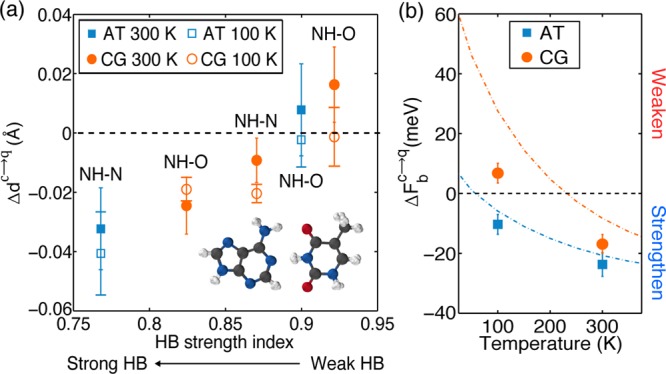
Figure 2.

(a) Differences between the heavy atom separation distances from PIMD and MD simulations. Positive changes mean that the N(H)–O or N(H)–N bonds are longer in the PIMD than those in the AIMD simulations; and negative values mean that they are shorter in PIMD. The five different HBs in the base pairs are arranged from left to right in order of decreasing strength, with strength characterized by the harmonic frequency of the N–H stretch in the HB divided by the harmonic frequency of the N–H stretch in the monomers.18 A snapshot of the AT base pair taken from a PIMD simulation is also shown in the inset; each sphere is a “bead” in the PIMD simulation. (b) Plot of the binding free energy change due to NQEs (eq 1) in the AT (blue) and CG (red) base pairs obtained from PIMD. A negative binding free energy change means that NQEs strengthen the binding, while a positive binding free energy change means that NQEs weaken the binding. Also shown with the dashed lines are the predictions of each base pair obtained within the harmonic approximation. The error bars in (a) and (b) have been calculated using block averaging.55
