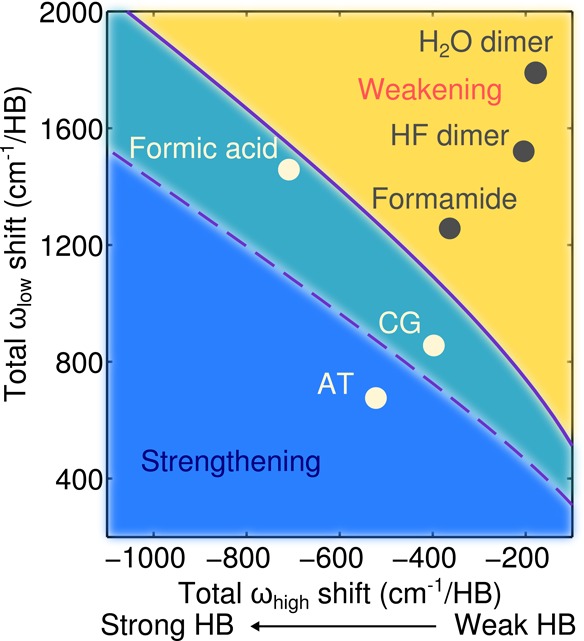
Figure 4.

Temperature at which NQEs switch from weakening to strengthening the binding for the model hydrogen-bonded system, plotted as a function of total high (ωhigh) and total low (ωlow) frequency mode shifts. The solid line marks the 300 K transition, whereas the dashed line marks the 100 K transition. Actual frequency changes corresponding to six specific dimers are also indicated on the figure; these data points correspond to the average changes per HB for frequencies computed within the harmonic approximation. At room temperature, the AT and CG base pairs and the formic acid dimer are in the strengthening regime, and the water dimer, HF dimer, and formamide dimer are in the weakening regime.
