
Figure 5.
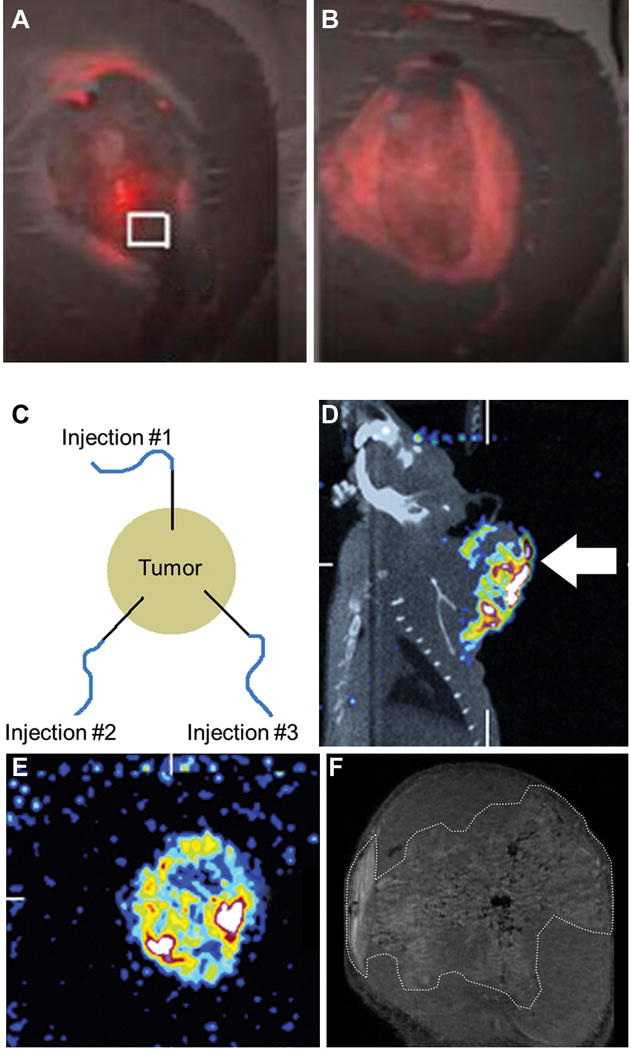
Fluorescent images of brain sections from rats bearing 9L-2 intracranial xenograft tumors following CED infusion of doxorubicin alone (A) or liposomal doxorubicin (B). Fluorescent images were superimposed on hematoxylin and eosin staining. Reproduced with permission from [130]. (C) Schematic diagram depicting the placement of catheters in a head and neck tumor for intratumoral CED infusion. (D) Sagittal SPECT/CT image of rat bearing head and neck tumor acquired 20 h after multiple intratumoral CED infusions of 186Re-liposomes to monitor tumor coverage by the liposomes. (E) Transaxial pinhole SPECT image of head and neck tumor acquired 20 h after multiple intratumoral CED infusions of 186Re-liposomes. (F) T1-weighted 7-Tesla MR image focused on the head and neck tumor after intratumoral CED infusion of gadolinium-liposomes. Intratumoral distribution of the gadolinium-liposomes has been circumscribed with dashed white line. Reproduced with permission from [145].