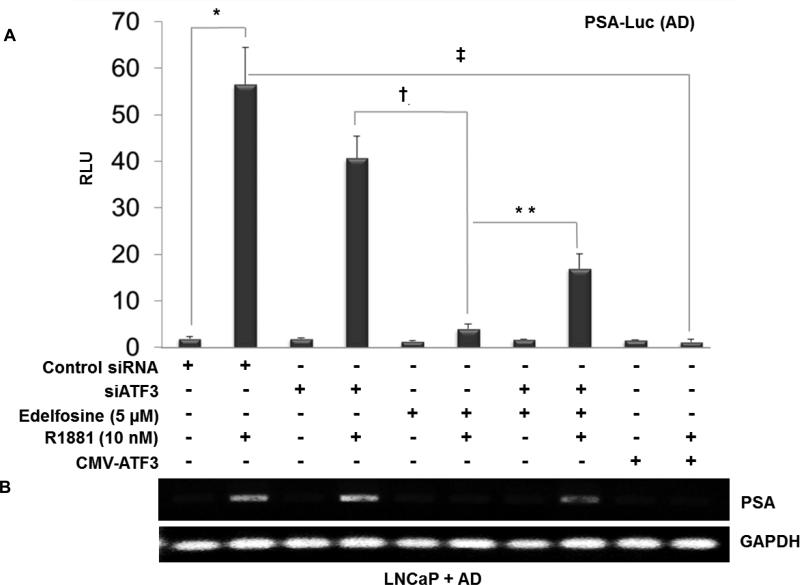
Figure 4. ATF3 represses AR transcriptional target PSA in LNCaP cells after AD and edelfosine treatment.
Androgen deprived LNCaP cells were co-transfected with PSA-luciferase reporter constructs (3 μg/well), CMV-ATF3 (3 μg), siATF3 or control siRNA (10 nM). To normalize the transfection efficiency, cells were co-transfected with renilla luciferase (30 ng/well). Following 3 h transfection the cells were treated with edelfosine (5 μM) and R1881 (10 nM). Cells were harvested 24 h post treatment, lysed and assayed for luciferase activity using the dual- luciferase reporter gene assay system. The data represents the ratio between firefly/renilla luciferase activities (mean ± SD, n = 3). *p < 0.001, compared to group without R1881, ‡p < 0.05, compared to R1881 alone, †p < 0.05, compared to group with siATF3, **p < 0.05, compared to group without siATF3 (one way ANOVA). (B) RT-PCR analysis for PSA mRNA expression. Parallel experiments were done with the treatment groups as in Figure 4A. Total RNA (2 μg) was reverse transcribed and the cDNA product was PCR amplified using PSA and GAPDH primers. A portion (10 μl from a 20 μl volume) of the PCR reaction product was electrophoresed on a 1.5% agarose gel. Electrophoresed and ethidium bromide stained PCR products from RT–PCR reactions were recorded under UV-transillumination using the Gel Doc XR system (Bio-Rad, Hercules, CA). RNA content was normalized with respect to the amount of GAPDH product.

