
Figure 4. Concentration of Seasonal and Occasional Houses Based on 2010 Census Data.
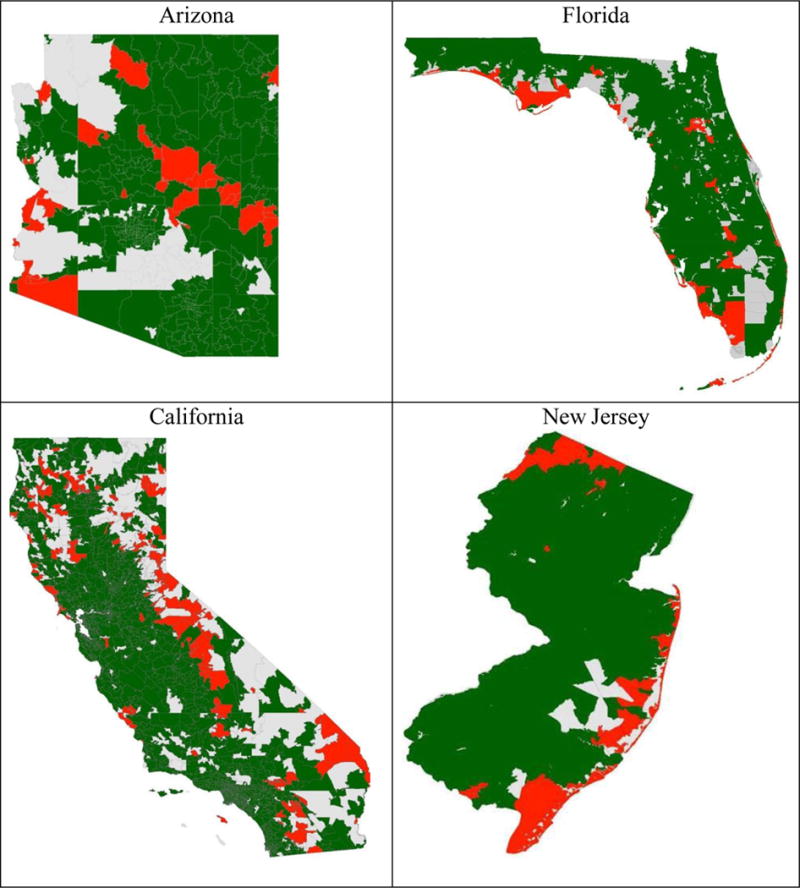
Note: Red areas represent ZCTAs that rank in the top 10% of zips for seasonal housing units. Grey areas are places that are not covered by a ZCTA, and include places such as large bodies of water or national/state parks. Source: U.S. Census Bureau.