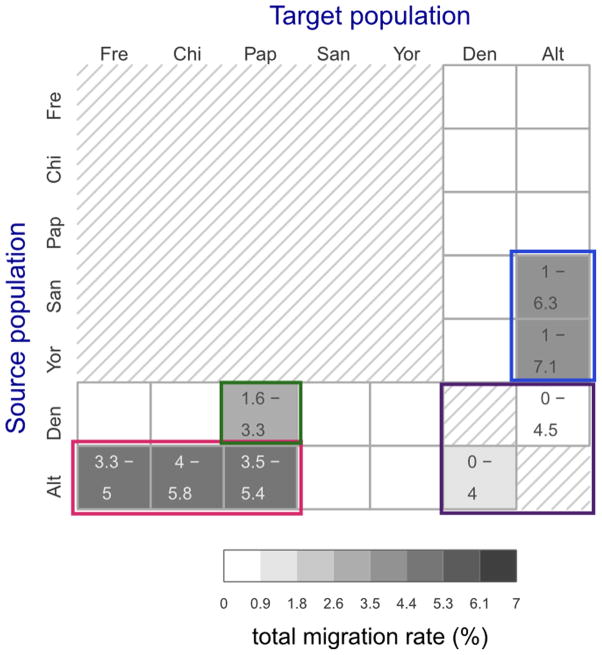
Extended Data Figure 1. Migration rates in preliminary demographic inference.
Total migration rates estimated for 22 directional migration bands in five separate preliminary G-PhoCS runs. Rows correspond to source populations and columns to the target populations. The 20 migration bands between modern and archaic populations were considered in five separate runs, each containing the four bands associated with a different modern human population (Supplementary Fig. 15A). The two migration bands between the Denisovan the Altai Neanderthal populations were considered in all five runs, and the values shown here correspond to an aggregate of all five runs. The estimates are as shown in Supplementary Fig. 15B. Shade indicates the posterior mean total migration rate (legend), which approximates the probability that a lineage in the target population originated in the source population. The 95% Bayesian credible intervals are indicated for migration bands whose upper credible interval bound is above 0.3%. We identified four clusters of migration bands, corresponding to what were likely at least four different cases of introgression between populations: (1) Neanderthals into non-African modern humans (red box), (2) Denisovans into Oceanians (green box), (3) between Neanderthals and Denisovans (magenta), and (4) modern humans into Neanderthals (blue box).

