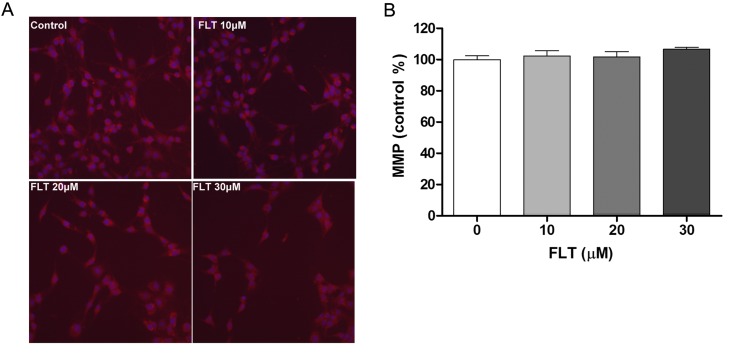
Figure 3.
Effect of fluoxetine (FLT) on mitochondrial membrane potential (MMP) in C6 glioma cells. (A) Mitochondrial localization of MitoTracker Red in C6 cells. By the application of MitoTracker Red, red fluorescence occurred in the surrounding mitochondrial membrane. (B) Quantitation of mean fluorescence intensity. The data are presented as means ± SEM from at least three independent experiments.

