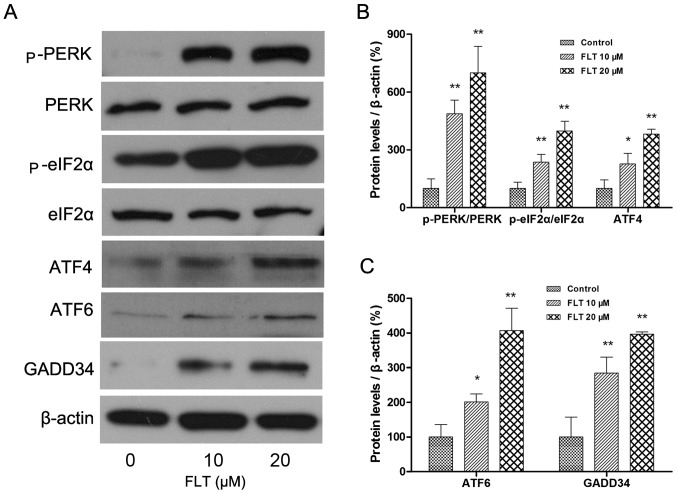
Figure 5.
Effect of fluoxetine (FLT) on ER stress sensors in C6 glioma cells. (A) Total proteins were extracted from the C6 cells treated with FLT for 24 h, and were subjected to western blot analyses. (B and C) The densitometric quantitation ratio of ER stress sensors (p-PERK/PERK, p-eIF2α/eIF2α, ATF4, ATF6 and GADD34) normalized to the β-actin level. The data are presented as mean ± SEM from at least three independent experiments (*P<0.05, **P<0.01 as compared with the control).

