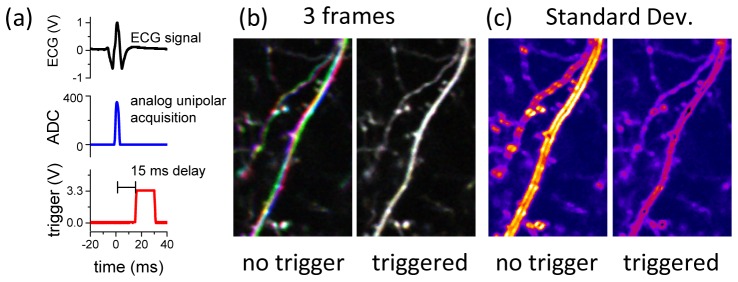
Fig. 4.
(a) Complete ECG signal at the output of the amplifier (top panel) and after rectification (middle panel). The lower panel shows the TTL signal generated by the Arduino Due to trigger the acquisition on its rising edge. (b) Imaging in vivo of dendrites expressing YFP without and with the heartbeat triggering. Three consecutive frames have been represented with a red, a green and a blue lookup table, and then superimposed. (c) Standard deviation images calculated by a 20 frames-long continuous acquisition, without and with the heartbeat triggering.

