Fig. 5.
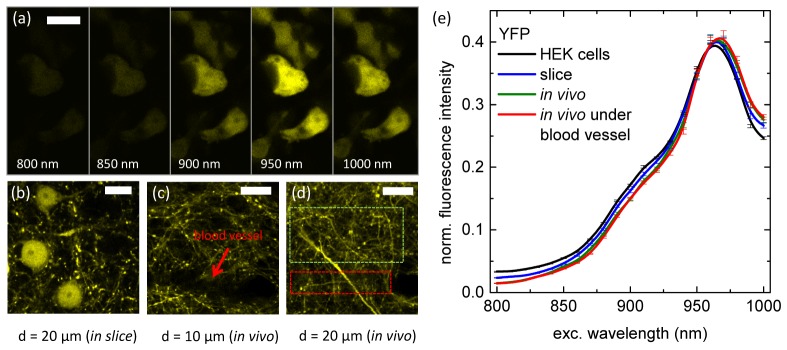
(a) Two-photon images of YFP expressing HEK 293 cells at different excitation wavelengths and at fixed excitation power (3mW). Only 5 of the 21 images of the whole spectrum are shown. (b) two-photon microscopy of layer-5 neurons excited at 960 nm. Imaging is performed in acute slice at a depth of 20 µm from the slice surface. (c) In vivo two-photon microscopy of dendrites in layers 2-3 of the somatosensory cortex. Imaging was performed 10 µm under the surface. The dark areas are indicative of superficial blood vessels. (d) Imaging in a region immediately under that vessel, at a depth of 20 µm. The red rectangle indicates the area immediately underneath the blood vessel. (e) two-photon excitation spectra of YFP expressed in HEK 293 cells (black), in layer-5 neurons in slice (blue), and in vivo (layers 2-3) under a blood vessel (red) and far from it (green). The last two spectra (the red one and the green one) are subtly different (see Fig. 6(a)), the red spectrum superimposes partially onto the green one. Scale bars: 20 µm.

