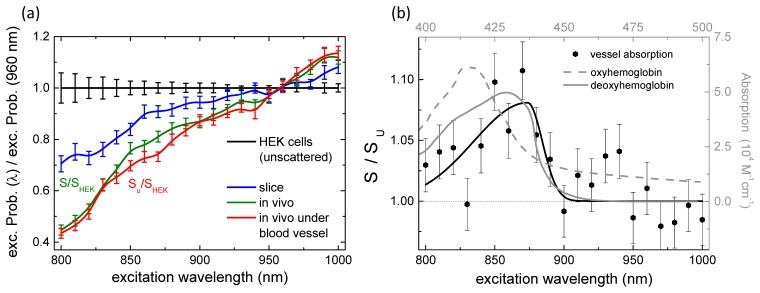
Fig. 6.
(a) Scaling of probability for two-photon excitation in scattering tissue as a function of wavelength, i.e. in slice (blue), in vivo under a blood vessel (red) and far from it (green). Data are obtained by dividing each YFP excitation spectrum by the reference spectrum obtained in scattering-free conditions (HEK 293), and by normalizing at 1 at 960nm. (b) Ratio between the in vivo YFP two-photon excitation spectra obtained far from the blood vessel (S) or directly underneath (Su). The error bars come from standard error propagation. This spectrum deformation is interpreted as caused by absorption phenomena and has been compared to the one-photon absorption of oxyhemoglobin (dashed gray line) and deoxyhemoglobin (solid grey line) peaked around 430 nm (top-right axes) (reproduced from Clay et al., 2007).

