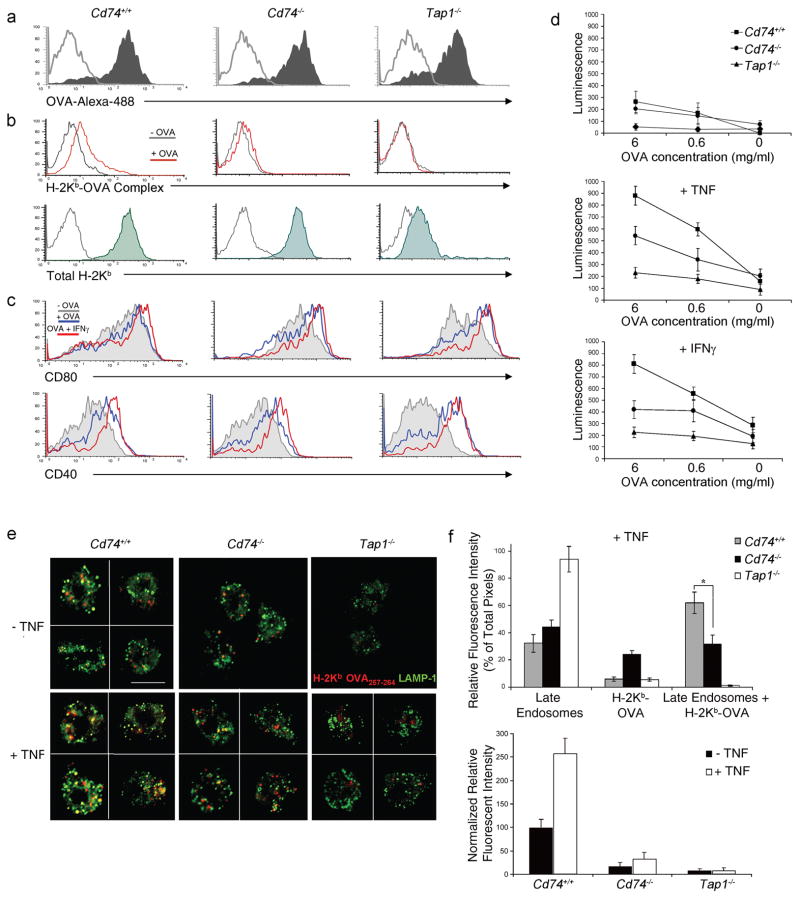
Figure 4. Cross-presentation and cross-priming is defective in Cd74−/−-derived DCs.
(a) BMDCs were incubated with OVA-Alexa-488 and uptake (shaded) was assessed over background (grey) by flow cytometry. (b) Formation of H-2Kb-OVA257-264 complexes on splenic DCs with (red) or without (grey) incubation with soluble OVA as well as total H-2Kb (shaded) above background (grey) was measured by flow cytometry. (c) Costimulatory receptors CD80 and CD40 on BMDCs were assessed by flow cytometry following incubation with OVA (blue), OVA+IFNγ (red) or media alone (grey). (d) Spleen-derived DCs were incubated with soluble OVA as indicated, in the presence of GM-CSF or GM-CSF and TNF or IFN-γ. Activation of B3Z T cells was measured using a chemiluminescent assay. Data depict means (± SD) of triplicate samples for each OVA concentration. Similar results were observed in 3 separate experiments. (e) Mature spleen-derived DCs incubated with OVA were costained with H-2Kb-OVA257-264 specific antibody (red) and LAMP-1 (green). The figure shows optically merged images representative of the majority of cells examined by ICM. Scale bar, 5 μm. (f) Quantitative assessment was performed comparing H-2Kb-OVA257-264 colocalization with LAMP-1+ late endosomes with or without TNF (top panel). Quantitative assessment comparing fluorescence between Cd74+/+, Cd74−/− and Tap1−/− DCs with TNF treatment (bottom panel). For each analysis >20 DCs per mouse strain were examined. Graph depicts normalized individual color pixel percentages per total pixels ± SD. * p < 0.05.

